Black/African American vs Immigrants from Eritrea In Labor Force | Age 30-34
COMPARE
Black/African American
Immigrants from Eritrea
In Labor Force | Age 30-34
In Labor Force | Age 30-34 Comparison
Blacks/African Americans
Immigrants from Eritrea
82.8%
IN LABOR FORCE | AGE 30-34
0.0/ 100
METRIC RATING
292nd/ 347
METRIC RANK
85.9%
IN LABOR FORCE | AGE 30-34
100.0/ 100
METRIC RATING
24th/ 347
METRIC RANK
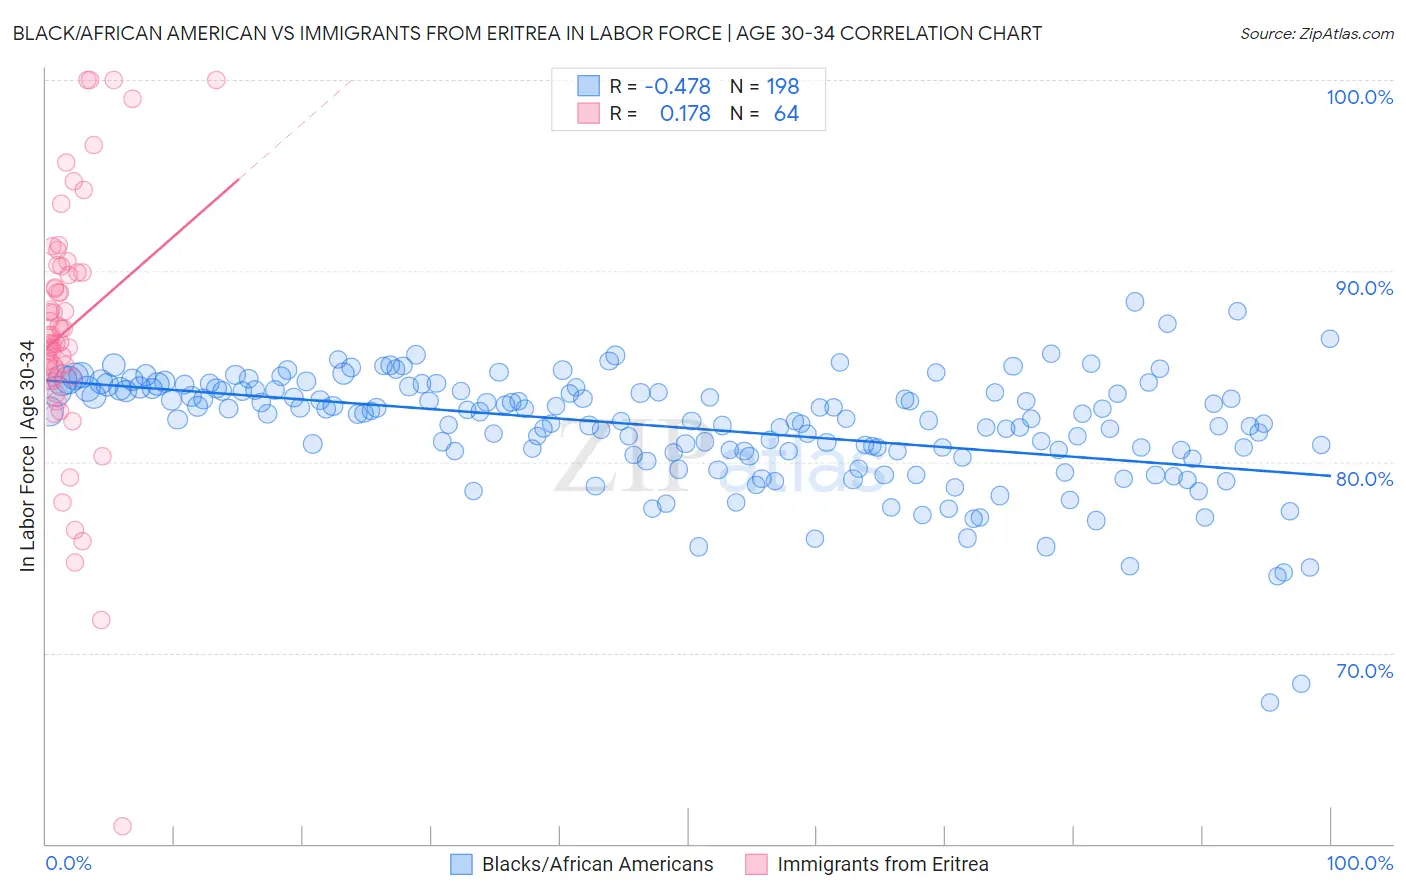
Black/African American vs Immigrants from Eritrea In Labor Force | Age 30-34 Correlation Chart
The statistical analysis conducted on geographies consisting of 564,859,333 people shows a moderate negative correlation between the proportion of Blacks/African Americans and labor force participation rate among population between the ages 30 and 34 in the United States with a correlation coefficient (R) of -0.478 and weighted average of 82.8%. Similarly, the statistical analysis conducted on geographies consisting of 104,841,565 people shows a poor positive correlation between the proportion of Immigrants from Eritrea and labor force participation rate among population between the ages 30 and 34 in the United States with a correlation coefficient (R) of 0.178 and weighted average of 85.9%, a difference of 3.8%.
In Labor Force | Age 30-34 Correlation Summary
| Measurement | Black/African American | Immigrants from Eritrea |
| Minimum | 67.4% | 60.9% |
| Maximum | 88.4% | 100.0% |
| Range | 21.0% | 39.1% |
| Mean | 81.8% | 87.0% |
| Median | 82.5% | 86.6% |
| Interquartile 25% (IQ1) | 80.5% | 84.6% |
| Interquartile 75% (IQ3) | 83.8% | 90.1% |
| Interquartile Range (IQR) | 3.3% | 5.5% |
| Standard Deviation (Sample) | 3.0% | 6.8% |
| Standard Deviation (Population) | 3.0% | 6.7% |
Similar Demographics by In Labor Force | Age 30-34
Demographics Similar to Blacks/African Americans by In Labor Force | Age 30-34
In terms of in labor force | age 30-34, the demographic groups most similar to Blacks/African Americans are Potawatomi (82.8%, a difference of 0.020%), Blackfeet (82.8%, a difference of 0.040%), Nepalese (82.7%, a difference of 0.060%), American (82.7%, a difference of 0.090%), and Pennsylvania German (82.6%, a difference of 0.21%).
| Demographics | Rating | Rank | In Labor Force | Age 30-34 |
| Cree | 0.0 /100 | #285 | Tragic 83.2% |
| Immigrants | Latin America | 0.0 /100 | #286 | Tragic 83.1% |
| Native Hawaiians | 0.0 /100 | #287 | Tragic 83.0% |
| Central American Indians | 0.0 /100 | #288 | Tragic 83.0% |
| Hawaiians | 0.0 /100 | #289 | Tragic 83.0% |
| Blackfeet | 0.0 /100 | #290 | Tragic 82.8% |
| Potawatomi | 0.0 /100 | #291 | Tragic 82.8% |
| Blacks/African Americans | 0.0 /100 | #292 | Tragic 82.8% |
| Nepalese | 0.0 /100 | #293 | Tragic 82.7% |
| Americans | 0.0 /100 | #294 | Tragic 82.7% |
| Pennsylvania Germans | 0.0 /100 | #295 | Tragic 82.6% |
| Chippewa | 0.0 /100 | #296 | Tragic 82.6% |
| Comanche | 0.0 /100 | #297 | Tragic 82.6% |
| Aleuts | 0.0 /100 | #298 | Tragic 82.6% |
| Immigrants | Central America | 0.0 /100 | #299 | Tragic 82.5% |
Demographics Similar to Immigrants from Eritrea by In Labor Force | Age 30-34
In terms of in labor force | age 30-34, the demographic groups most similar to Immigrants from Eritrea are Bermudan (85.9%, a difference of 0.010%), Estonian (85.9%, a difference of 0.010%), Immigrants from North Macedonia (85.9%, a difference of 0.010%), Immigrants from Eastern Africa (85.9%, a difference of 0.020%), and Immigrants from Liberia (85.9%, a difference of 0.030%).
| Demographics | Rating | Rank | In Labor Force | Age 30-34 |
| Immigrants | Cameroon | 100.0 /100 | #17 | Exceptional 86.0% |
| Immigrants | Sierra Leone | 100.0 /100 | #18 | Exceptional 86.0% |
| Sierra Leoneans | 100.0 /100 | #19 | Exceptional 86.0% |
| Bulgarians | 100.0 /100 | #20 | Exceptional 86.0% |
| Immigrants | Bulgaria | 100.0 /100 | #21 | Exceptional 86.0% |
| Bermudans | 100.0 /100 | #22 | Exceptional 85.9% |
| Estonians | 100.0 /100 | #23 | Exceptional 85.9% |
| Immigrants | Eritrea | 100.0 /100 | #24 | Exceptional 85.9% |
| Immigrants | North Macedonia | 100.0 /100 | #25 | Exceptional 85.9% |
| Immigrants | Eastern Africa | 100.0 /100 | #26 | Exceptional 85.9% |
| Immigrants | Liberia | 100.0 /100 | #27 | Exceptional 85.9% |
| Immigrants | Latvia | 100.0 /100 | #28 | Exceptional 85.9% |
| Tsimshian | 100.0 /100 | #29 | Exceptional 85.8% |
| Immigrants | Hong Kong | 100.0 /100 | #30 | Exceptional 85.8% |
| Paraguayans | 99.9 /100 | #31 | Exceptional 85.8% |