Black/African American vs Immigrants from Armenia Male Poverty
COMPARE
Black/African American
Immigrants from Armenia
Male Poverty
Male Poverty Comparison
Blacks/African Americans
Immigrants from Armenia
15.8%
MALE POVERTY
0.0/ 100
METRIC RATING
328th/ 347
METRIC RANK
12.6%
MALE POVERTY
0.6/ 100
METRIC RATING
234th/ 347
METRIC RANK
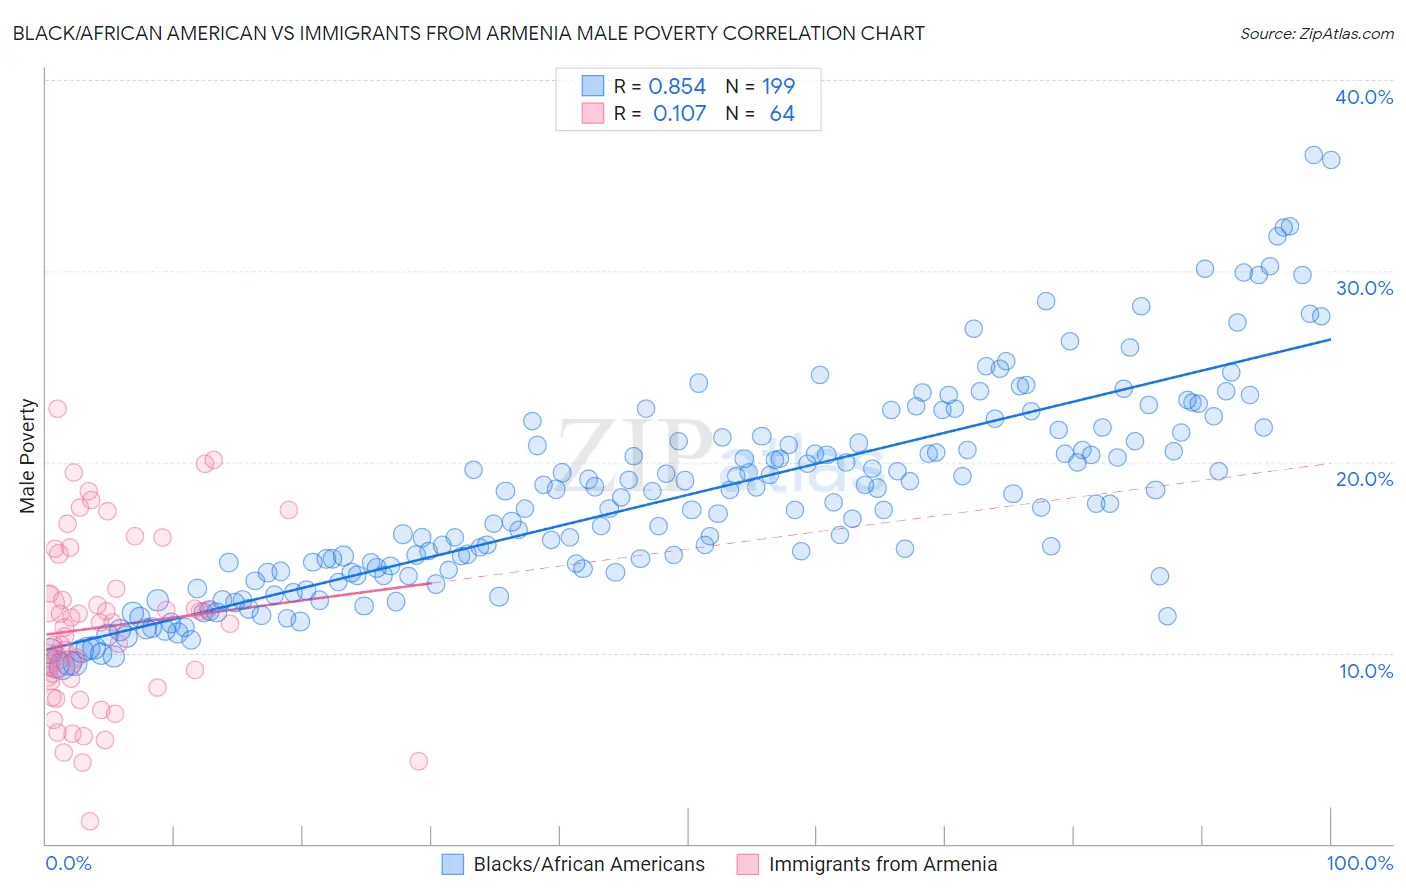
Black/African American vs Immigrants from Armenia Male Poverty Correlation Chart
The statistical analysis conducted on geographies consisting of 564,646,557 people shows a very strong positive correlation between the proportion of Blacks/African Americans and poverty level among males in the United States with a correlation coefficient (R) of 0.854 and weighted average of 15.8%. Similarly, the statistical analysis conducted on geographies consisting of 97,715,591 people shows a poor positive correlation between the proportion of Immigrants from Armenia and poverty level among males in the United States with a correlation coefficient (R) of 0.107 and weighted average of 12.6%, a difference of 25.5%.
Male Poverty Correlation Summary
| Measurement | Black/African American | Immigrants from Armenia |
| Minimum | 9.3% | 1.2% |
| Maximum | 36.0% | 22.8% |
| Range | 26.8% | 21.6% |
| Mean | 18.2% | 11.3% |
| Median | 17.9% | 11.1% |
| Interquartile 25% (IQ1) | 14.2% | 8.6% |
| Interquartile 75% (IQ3) | 21.3% | 13.2% |
| Interquartile Range (IQR) | 7.1% | 4.6% |
| Standard Deviation (Sample) | 5.5% | 4.4% |
| Standard Deviation (Population) | 5.5% | 4.4% |
Similar Demographics by Male Poverty
Demographics Similar to Blacks/African Americans by Male Poverty
In terms of male poverty, the demographic groups most similar to Blacks/African Americans are Paiute (15.8%, a difference of 0.060%), Dominican (16.1%, a difference of 1.7%), Immigrants from Dominican Republic (16.2%, a difference of 2.4%), Ute (16.2%, a difference of 2.7%), and Central American Indian (15.3%, a difference of 3.2%).
| Demographics | Rating | Rank | Male Poverty |
| Arapaho | 0.0 /100 | #321 | Tragic 15.1% |
| Kiowa | 0.0 /100 | #322 | Tragic 15.2% |
| Colville | 0.0 /100 | #323 | Tragic 15.2% |
| Menominee | 0.0 /100 | #324 | Tragic 15.3% |
| Yakama | 0.0 /100 | #325 | Tragic 15.3% |
| Central American Indians | 0.0 /100 | #326 | Tragic 15.3% |
| Paiute | 0.0 /100 | #327 | Tragic 15.8% |
| Blacks/African Americans | 0.0 /100 | #328 | Tragic 15.8% |
| Dominicans | 0.0 /100 | #329 | Tragic 16.1% |
| Immigrants | Dominican Republic | 0.0 /100 | #330 | Tragic 16.2% |
| Ute | 0.0 /100 | #331 | Tragic 16.2% |
| Houma | 0.0 /100 | #332 | Tragic 16.7% |
| Natives/Alaskans | 0.0 /100 | #333 | Tragic 16.9% |
| Cheyenne | 0.0 /100 | #334 | Tragic 17.6% |
| Apache | 0.0 /100 | #335 | Tragic 17.7% |
Demographics Similar to Immigrants from Armenia by Male Poverty
In terms of male poverty, the demographic groups most similar to Immigrants from Armenia are Fijian (12.6%, a difference of 0.060%), Nicaraguan (12.6%, a difference of 0.11%), Salvadoran (12.6%, a difference of 0.23%), Immigrants from Laos (12.6%, a difference of 0.36%), and Immigrants from Saudi Arabia (12.7%, a difference of 0.61%).
| Demographics | Rating | Rank | Male Poverty |
| Alaska Natives | 1.4 /100 | #227 | Tragic 12.4% |
| Alsatians | 1.3 /100 | #228 | Tragic 12.4% |
| Cubans | 1.3 /100 | #229 | Tragic 12.4% |
| Marshallese | 0.8 /100 | #230 | Tragic 12.5% |
| Salvadorans | 0.6 /100 | #231 | Tragic 12.6% |
| Nicaraguans | 0.6 /100 | #232 | Tragic 12.6% |
| Fijians | 0.6 /100 | #233 | Tragic 12.6% |
| Immigrants | Armenia | 0.6 /100 | #234 | Tragic 12.6% |
| Immigrants | Laos | 0.5 /100 | #235 | Tragic 12.6% |
| Immigrants | Saudi Arabia | 0.4 /100 | #236 | Tragic 12.7% |
| French American Indians | 0.4 /100 | #237 | Tragic 12.7% |
| Ecuadorians | 0.4 /100 | #238 | Tragic 12.7% |
| Ghanaians | 0.4 /100 | #239 | Tragic 12.7% |
| Immigrants | Middle Africa | 0.4 /100 | #240 | Tragic 12.7% |
| Sudanese | 0.3 /100 | #241 | Tragic 12.8% |