Black/African American vs Immigrants from Eritrea 2nd Grade
COMPARE
Black/African American
Immigrants from Eritrea
2nd Grade
2nd Grade Comparison
Blacks/African Americans
Immigrants from Eritrea
97.8%
2ND GRADE
29.9/ 100
METRIC RATING
192nd/ 347
METRIC RANK
97.2%
2ND GRADE
0.0/ 100
METRIC RATING
292nd/ 347
METRIC RANK
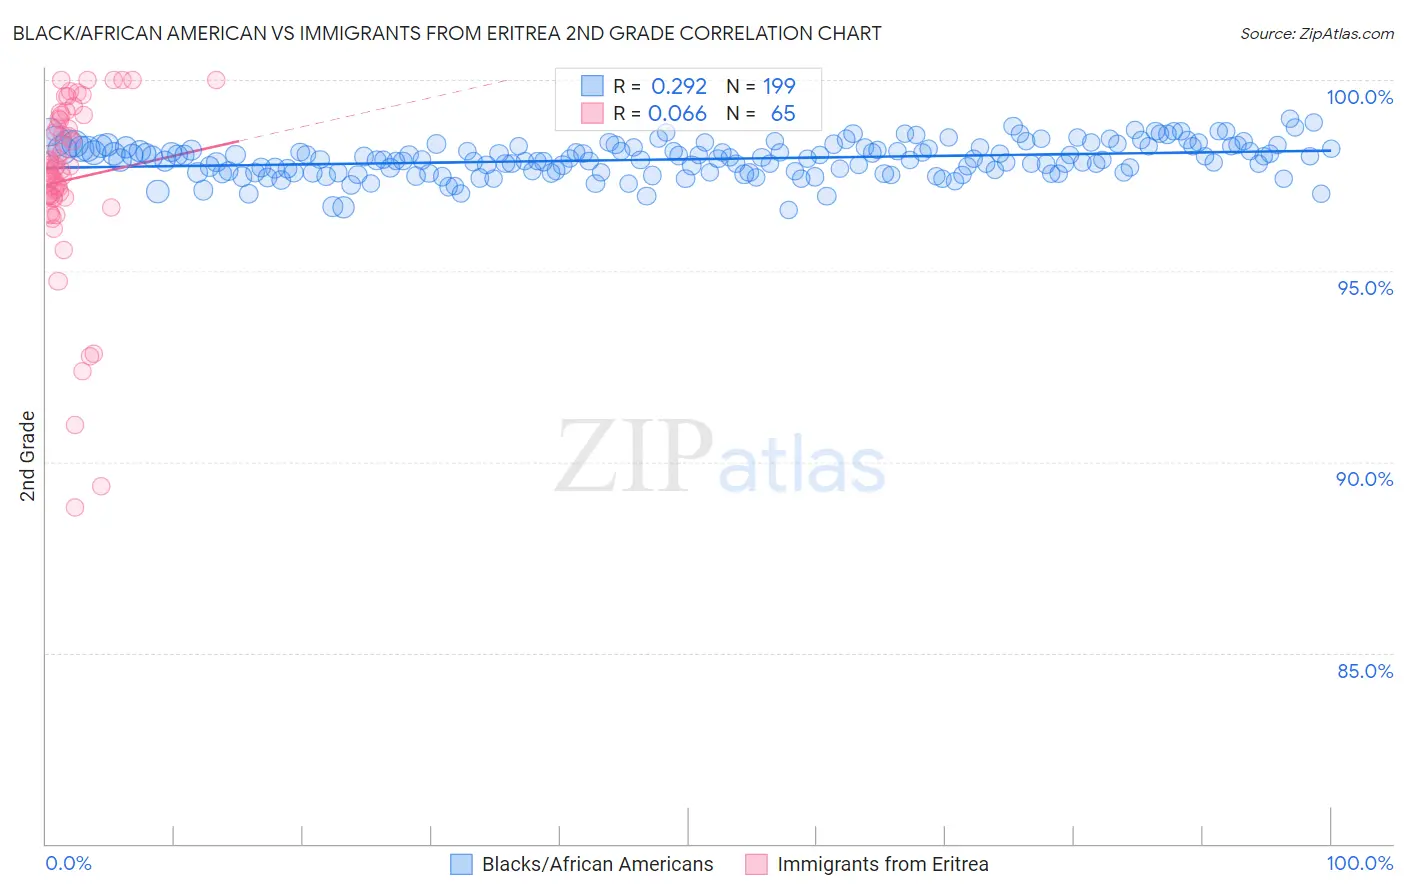
Black/African American vs Immigrants from Eritrea 2nd Grade Correlation Chart
The statistical analysis conducted on geographies consisting of 566,043,750 people shows a weak positive correlation between the proportion of Blacks/African Americans and percentage of population with at least 2nd grade education in the United States with a correlation coefficient (R) of 0.292 and weighted average of 97.8%. Similarly, the statistical analysis conducted on geographies consisting of 104,801,381 people shows a slight positive correlation between the proportion of Immigrants from Eritrea and percentage of population with at least 2nd grade education in the United States with a correlation coefficient (R) of 0.066 and weighted average of 97.2%, a difference of 0.65%.
2nd Grade Correlation Summary
| Measurement | Black/African American | Immigrants from Eritrea |
| Minimum | 96.6% | 88.8% |
| Maximum | 99.0% | 100.0% |
| Range | 2.4% | 11.2% |
| Mean | 97.9% | 97.4% |
| Median | 97.9% | 97.7% |
| Interquartile 25% (IQ1) | 97.6% | 96.9% |
| Interquartile 75% (IQ3) | 98.2% | 99.0% |
| Interquartile Range (IQR) | 0.66% | 2.1% |
| Standard Deviation (Sample) | 0.44% | 2.4% |
| Standard Deviation (Population) | 0.44% | 2.4% |
Similar Demographics by 2nd Grade
Demographics Similar to Blacks/African Americans by 2nd Grade
In terms of 2nd grade, the demographic groups most similar to Blacks/African Americans are Paraguayan (97.8%, a difference of 0.0%), Panamanian (97.8%, a difference of 0.010%), Immigrants from Taiwan (97.8%, a difference of 0.010%), Hawaiian (97.8%, a difference of 0.010%), and Paiute (97.8%, a difference of 0.010%).
| Demographics | Rating | Rank | 2nd Grade |
| Immigrants | Argentina | 40.6 /100 | #185 | Average 97.8% |
| Arabs | 36.9 /100 | #186 | Fair 97.8% |
| Pakistanis | 36.1 /100 | #187 | Fair 97.8% |
| Immigrants | Kazakhstan | 35.6 /100 | #188 | Fair 97.8% |
| Panamanians | 33.5 /100 | #189 | Fair 97.8% |
| Immigrants | Taiwan | 31.8 /100 | #190 | Fair 97.8% |
| Paraguayans | 30.8 /100 | #191 | Fair 97.8% |
| Blacks/African Americans | 29.9 /100 | #192 | Fair 97.8% |
| Hawaiians | 28.5 /100 | #193 | Fair 97.8% |
| Paiute | 27.0 /100 | #194 | Fair 97.8% |
| Mongolians | 26.7 /100 | #195 | Fair 97.8% |
| Immigrants | Kenya | 26.4 /100 | #196 | Fair 97.8% |
| Immigrants | Uganda | 26.3 /100 | #197 | Fair 97.8% |
| Guamanians/Chamorros | 25.7 /100 | #198 | Fair 97.8% |
| Immigrants | Egypt | 24.4 /100 | #199 | Fair 97.8% |
Demographics Similar to Immigrants from Eritrea by 2nd Grade
In terms of 2nd grade, the demographic groups most similar to Immigrants from Eritrea are British West Indian (97.2%, a difference of 0.010%), Immigrants from Afghanistan (97.2%, a difference of 0.020%), Houma (97.2%, a difference of 0.030%), Immigrants from St. Vincent and the Grenadines (97.2%, a difference of 0.030%), and Malaysian (97.1%, a difference of 0.040%).
| Demographics | Rating | Rank | 2nd Grade |
| Immigrants | Hong Kong | 0.0 /100 | #285 | Tragic 97.2% |
| Immigrants | Barbados | 0.0 /100 | #286 | Tragic 97.2% |
| Immigrants | Portugal | 0.0 /100 | #287 | Tragic 97.2% |
| Immigrants | Thailand | 0.0 /100 | #288 | Tragic 97.2% |
| Houma | 0.0 /100 | #289 | Tragic 97.2% |
| Immigrants | St. Vincent and the Grenadines | 0.0 /100 | #290 | Tragic 97.2% |
| Immigrants | Afghanistan | 0.0 /100 | #291 | Tragic 97.2% |
| Immigrants | Eritrea | 0.0 /100 | #292 | Tragic 97.2% |
| British West Indians | 0.0 /100 | #293 | Tragic 97.2% |
| Malaysians | 0.0 /100 | #294 | Tragic 97.1% |
| Immigrants | Grenada | 0.0 /100 | #295 | Tragic 97.1% |
| Immigrants | Immigrants | 0.0 /100 | #296 | Tragic 97.1% |
| Immigrants | Cuba | 0.0 /100 | #297 | Tragic 97.0% |
| Immigrants | Dominica | 0.0 /100 | #298 | Tragic 97.0% |
| Haitians | 0.0 /100 | #299 | Tragic 97.0% |