Brazilian vs Immigrants from Uruguay Single Mother Poverty
COMPARE
Brazilian
Immigrants from Uruguay
Single Mother Poverty
Single Mother Poverty Comparison
Brazilians
Immigrants from Uruguay
28.3%
SINGLE MOTHER POVERTY
92.4/ 100
METRIC RATING
118th/ 347
METRIC RANK
29.1%
SINGLE MOTHER POVERTY
57.2/ 100
METRIC RATING
169th/ 347
METRIC RANK
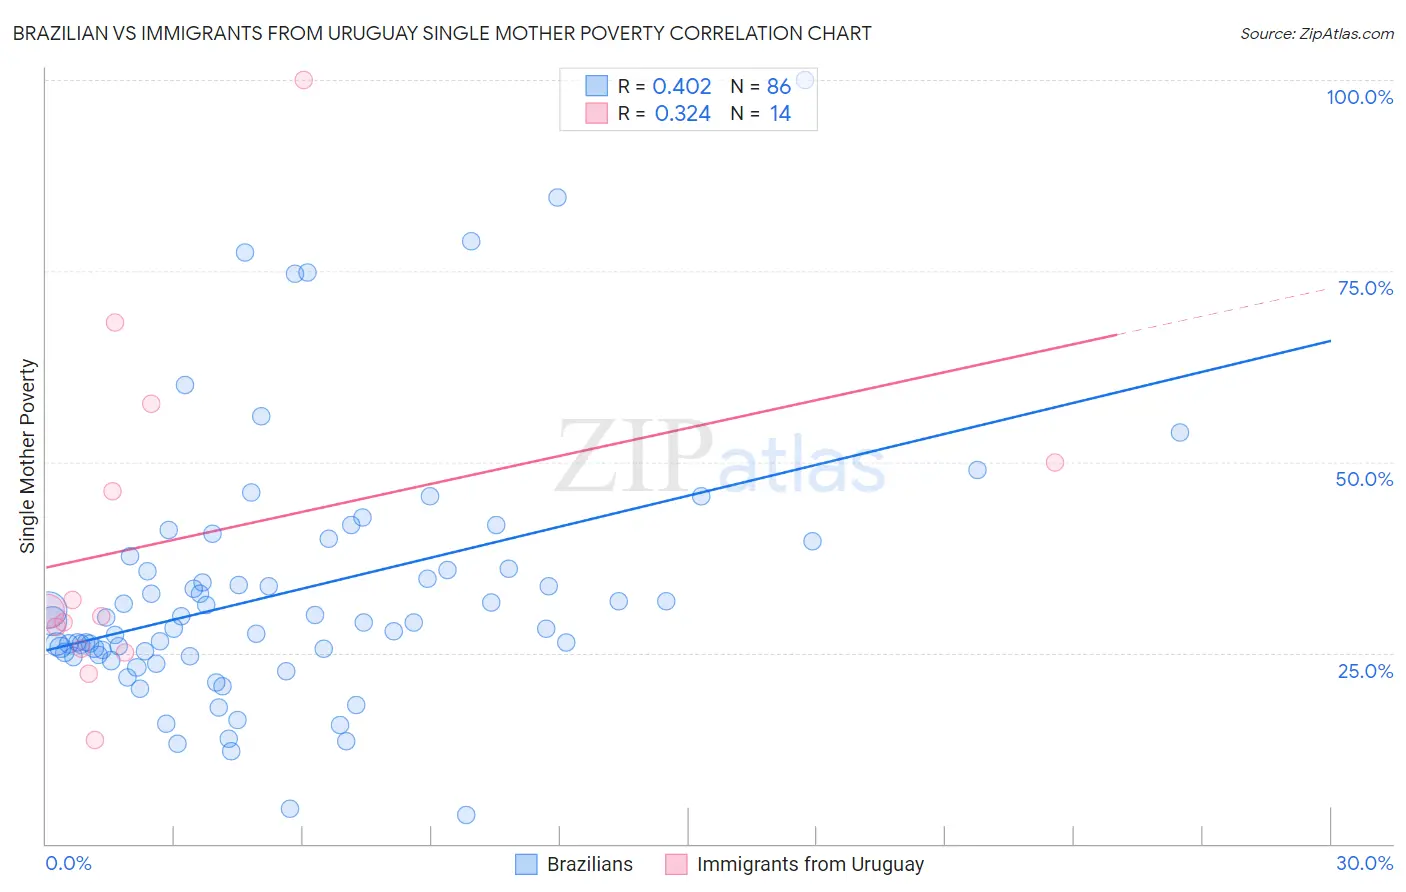
Brazilian vs Immigrants from Uruguay Single Mother Poverty Correlation Chart
The statistical analysis conducted on geographies consisting of 317,046,418 people shows a moderate positive correlation between the proportion of Brazilians and poverty level among single mothers in the United States with a correlation coefficient (R) of 0.402 and weighted average of 28.3%. Similarly, the statistical analysis conducted on geographies consisting of 131,793,407 people shows a mild positive correlation between the proportion of Immigrants from Uruguay and poverty level among single mothers in the United States with a correlation coefficient (R) of 0.324 and weighted average of 29.1%, a difference of 2.7%.
Single Mother Poverty Correlation Summary
| Measurement | Brazilian | Immigrants from Uruguay |
| Minimum | 3.8% | 13.7% |
| Maximum | 100.0% | 100.0% |
| Range | 96.2% | 86.3% |
| Mean | 33.0% | 39.9% |
| Median | 29.0% | 30.1% |
| Interquartile 25% (IQ1) | 24.7% | 25.6% |
| Interquartile 75% (IQ3) | 36.1% | 50.0% |
| Interquartile Range (IQR) | 11.4% | 24.4% |
| Standard Deviation (Sample) | 16.9% | 22.9% |
| Standard Deviation (Population) | 16.8% | 22.1% |
Similar Demographics by Single Mother Poverty
Demographics Similar to Brazilians by Single Mother Poverty
In terms of single mother poverty, the demographic groups most similar to Brazilians are Australian (28.3%, a difference of 0.010%), Immigrants from Syria (28.3%, a difference of 0.010%), Immigrants from Uganda (28.3%, a difference of 0.020%), Cypriot (28.3%, a difference of 0.030%), and Immigrants from Kuwait (28.3%, a difference of 0.040%).
| Demographics | Rating | Rank | Single Mother Poverty |
| Venezuelans | 94.5 /100 | #111 | Exceptional 28.2% |
| Immigrants | Kazakhstan | 94.5 /100 | #112 | Exceptional 28.2% |
| Immigrants | South Africa | 93.2 /100 | #113 | Exceptional 28.3% |
| Immigrants | Western Asia | 92.7 /100 | #114 | Exceptional 28.3% |
| Immigrants | Kuwait | 92.7 /100 | #115 | Exceptional 28.3% |
| Immigrants | Uganda | 92.5 /100 | #116 | Exceptional 28.3% |
| Australians | 92.5 /100 | #117 | Exceptional 28.3% |
| Brazilians | 92.4 /100 | #118 | Exceptional 28.3% |
| Immigrants | Syria | 92.4 /100 | #119 | Exceptional 28.3% |
| Cypriots | 92.3 /100 | #120 | Exceptional 28.3% |
| Immigrants | Afghanistan | 92.1 /100 | #121 | Exceptional 28.3% |
| Colombians | 91.8 /100 | #122 | Exceptional 28.3% |
| Uruguayans | 91.7 /100 | #123 | Exceptional 28.3% |
| Immigrants | Switzerland | 91.7 /100 | #124 | Exceptional 28.3% |
| Kenyans | 90.9 /100 | #125 | Exceptional 28.4% |
Demographics Similar to Immigrants from Uruguay by Single Mother Poverty
In terms of single mother poverty, the demographic groups most similar to Immigrants from Uruguay are European (29.1%, a difference of 0.020%), Costa Rican (29.0%, a difference of 0.060%), New Zealander (29.1%, a difference of 0.10%), Puget Sound Salish (29.1%, a difference of 0.11%), and Inupiat (29.0%, a difference of 0.16%).
| Demographics | Rating | Rank | Single Mother Poverty |
| Scandinavians | 66.2 /100 | #162 | Good 28.9% |
| Immigrants | Nigeria | 65.9 /100 | #163 | Good 28.9% |
| Immigrants | Kenya | 65.9 /100 | #164 | Good 28.9% |
| Arabs | 60.7 /100 | #165 | Good 29.0% |
| Inupiat | 60.4 /100 | #166 | Good 29.0% |
| Costa Ricans | 58.4 /100 | #167 | Average 29.0% |
| Europeans | 57.6 /100 | #168 | Average 29.1% |
| Immigrants | Uruguay | 57.2 /100 | #169 | Average 29.1% |
| New Zealanders | 55.1 /100 | #170 | Average 29.1% |
| Puget Sound Salish | 55.1 /100 | #171 | Average 29.1% |
| Carpatho Rusyns | 53.8 /100 | #172 | Average 29.1% |
| British | 50.6 /100 | #173 | Average 29.2% |
| Immigrants | Saudi Arabia | 50.0 /100 | #174 | Average 29.2% |
| Immigrants | Costa Rica | 48.8 /100 | #175 | Average 29.2% |
| Hawaiians | 47.8 /100 | #176 | Average 29.2% |