Bolivian vs Immigrants from Uruguay Single Mother Poverty
COMPARE
Bolivian
Immigrants from Uruguay
Single Mother Poverty
Single Mother Poverty Comparison
Bolivians
Immigrants from Uruguay
25.9%
SINGLE MOTHER POVERTY
100.0/ 100
METRIC RATING
16th/ 347
METRIC RANK
29.1%
SINGLE MOTHER POVERTY
57.2/ 100
METRIC RATING
169th/ 347
METRIC RANK
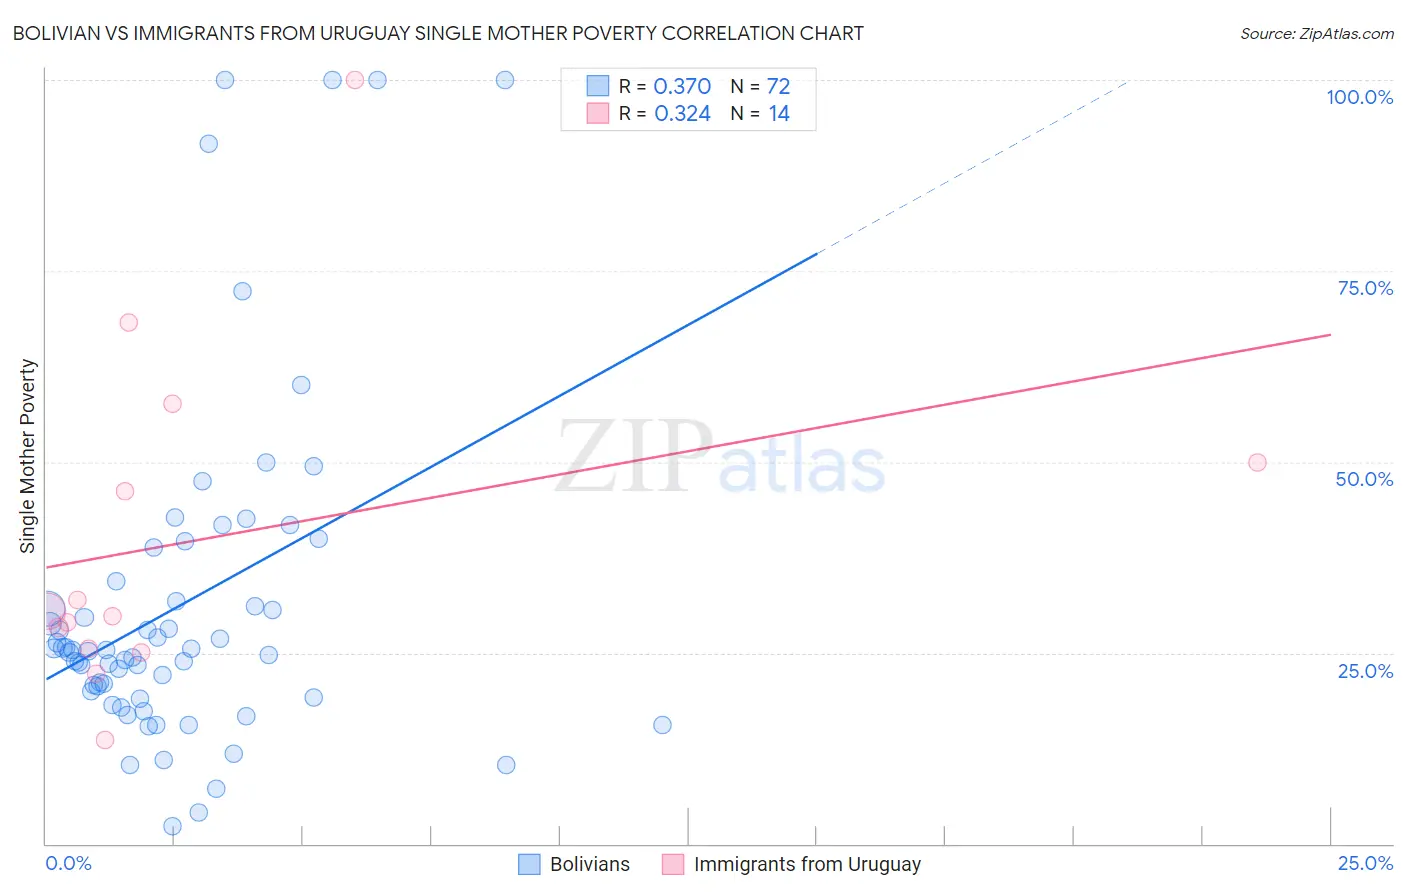
Bolivian vs Immigrants from Uruguay Single Mother Poverty Correlation Chart
The statistical analysis conducted on geographies consisting of 182,525,301 people shows a mild positive correlation between the proportion of Bolivians and poverty level among single mothers in the United States with a correlation coefficient (R) of 0.370 and weighted average of 25.9%. Similarly, the statistical analysis conducted on geographies consisting of 131,793,407 people shows a mild positive correlation between the proportion of Immigrants from Uruguay and poverty level among single mothers in the United States with a correlation coefficient (R) of 0.324 and weighted average of 29.1%, a difference of 12.2%.
Single Mother Poverty Correlation Summary
| Measurement | Bolivian | Immigrants from Uruguay |
| Minimum | 2.2% | 13.7% |
| Maximum | 100.0% | 100.0% |
| Range | 97.8% | 86.3% |
| Mean | 31.3% | 39.9% |
| Median | 25.3% | 30.1% |
| Interquartile 25% (IQ1) | 19.6% | 25.6% |
| Interquartile 75% (IQ3) | 33.1% | 50.0% |
| Interquartile Range (IQR) | 13.5% | 24.4% |
| Standard Deviation (Sample) | 22.0% | 22.9% |
| Standard Deviation (Population) | 21.8% | 22.1% |
Similar Demographics by Single Mother Poverty
Demographics Similar to Bolivians by Single Mother Poverty
In terms of single mother poverty, the demographic groups most similar to Bolivians are Asian (26.0%, a difference of 0.18%), Immigrants from Ireland (25.8%, a difference of 0.29%), Immigrants from Pakistan (26.0%, a difference of 0.46%), Immigrants from Singapore (25.8%, a difference of 0.47%), and Immigrants from Eastern Asia (26.1%, a difference of 0.61%).
| Demographics | Rating | Rank | Single Mother Poverty |
| Immigrants | Lithuania | 100.0 /100 | #9 | Exceptional 25.2% |
| Immigrants | South Central Asia | 100.0 /100 | #10 | Exceptional 25.3% |
| Iranians | 100.0 /100 | #11 | Exceptional 25.5% |
| Bhutanese | 100.0 /100 | #12 | Exceptional 25.6% |
| Indians (Asian) | 100.0 /100 | #13 | Exceptional 25.8% |
| Immigrants | Singapore | 100.0 /100 | #14 | Exceptional 25.8% |
| Immigrants | Ireland | 100.0 /100 | #15 | Exceptional 25.8% |
| Bolivians | 100.0 /100 | #16 | Exceptional 25.9% |
| Asians | 100.0 /100 | #17 | Exceptional 26.0% |
| Immigrants | Pakistan | 100.0 /100 | #18 | Exceptional 26.0% |
| Immigrants | Eastern Asia | 100.0 /100 | #19 | Exceptional 26.1% |
| Immigrants | China | 100.0 /100 | #20 | Exceptional 26.1% |
| Immigrants | Bolivia | 100.0 /100 | #21 | Exceptional 26.2% |
| Immigrants | Korea | 100.0 /100 | #22 | Exceptional 26.2% |
| Burmese | 100.0 /100 | #23 | Exceptional 26.2% |
Demographics Similar to Immigrants from Uruguay by Single Mother Poverty
In terms of single mother poverty, the demographic groups most similar to Immigrants from Uruguay are European (29.1%, a difference of 0.020%), Costa Rican (29.0%, a difference of 0.060%), New Zealander (29.1%, a difference of 0.10%), Puget Sound Salish (29.1%, a difference of 0.11%), and Inupiat (29.0%, a difference of 0.16%).
| Demographics | Rating | Rank | Single Mother Poverty |
| Scandinavians | 66.2 /100 | #162 | Good 28.9% |
| Immigrants | Nigeria | 65.9 /100 | #163 | Good 28.9% |
| Immigrants | Kenya | 65.9 /100 | #164 | Good 28.9% |
| Arabs | 60.7 /100 | #165 | Good 29.0% |
| Inupiat | 60.4 /100 | #166 | Good 29.0% |
| Costa Ricans | 58.4 /100 | #167 | Average 29.0% |
| Europeans | 57.6 /100 | #168 | Average 29.1% |
| Immigrants | Uruguay | 57.2 /100 | #169 | Average 29.1% |
| New Zealanders | 55.1 /100 | #170 | Average 29.1% |
| Puget Sound Salish | 55.1 /100 | #171 | Average 29.1% |
| Carpatho Rusyns | 53.8 /100 | #172 | Average 29.1% |
| British | 50.6 /100 | #173 | Average 29.2% |
| Immigrants | Saudi Arabia | 50.0 /100 | #174 | Average 29.2% |
| Immigrants | Costa Rica | 48.8 /100 | #175 | Average 29.2% |
| Hawaiians | 47.8 /100 | #176 | Average 29.2% |