Barbadian vs Eastern European Male Poverty
COMPARE
Barbadian
Eastern European
Male Poverty
Male Poverty Comparison
Barbadians
Eastern Europeans
13.6%
MALE POVERTY
0.0/ 100
METRIC RATING
275th/ 347
METRIC RANK
9.6%
MALE POVERTY
99.6/ 100
METRIC RATING
25th/ 347
METRIC RANK
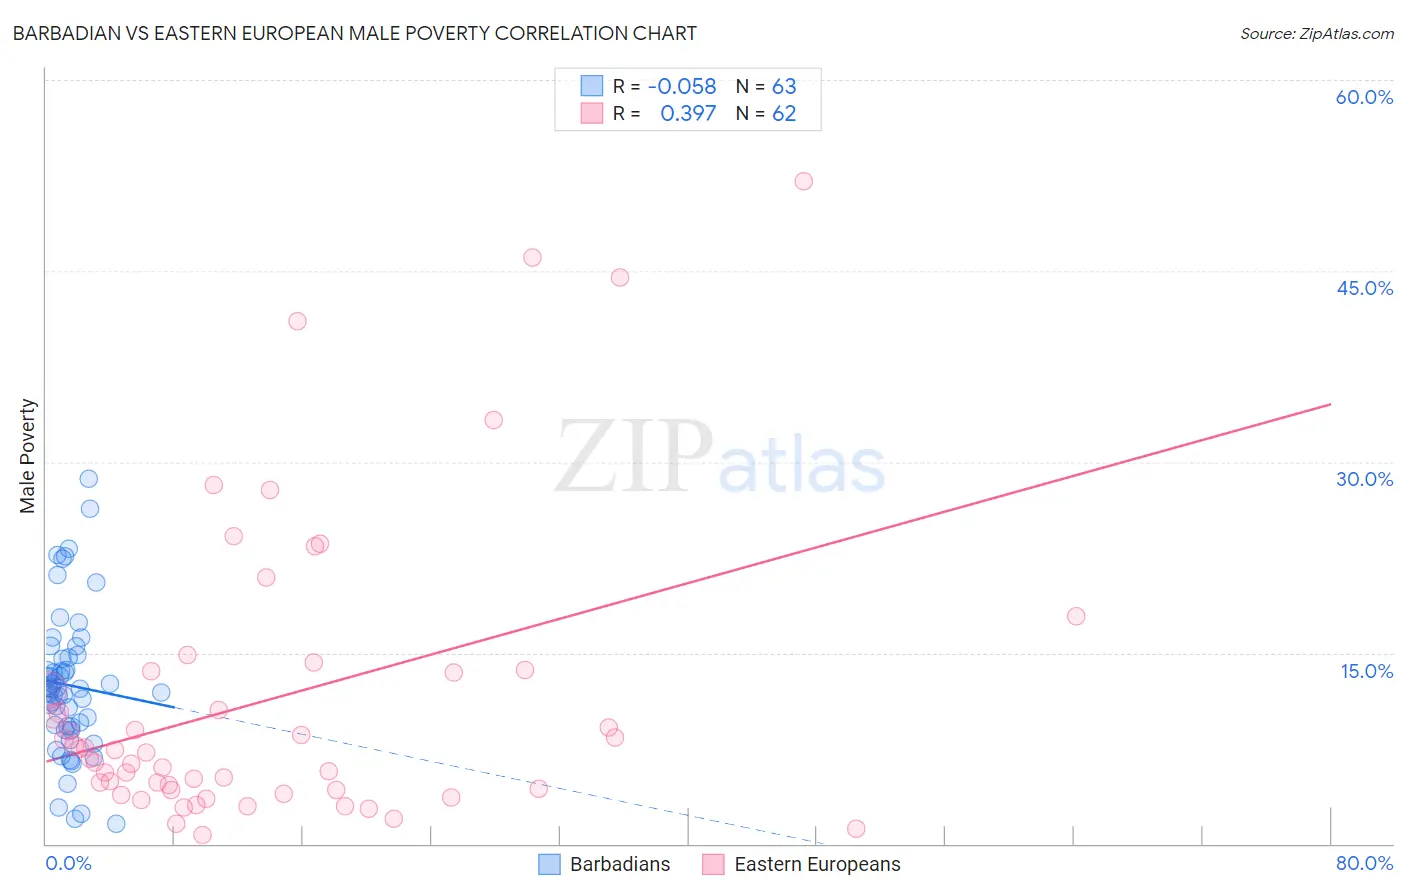
Barbadian vs Eastern European Male Poverty Correlation Chart
The statistical analysis conducted on geographies consisting of 141,266,401 people shows a slight negative correlation between the proportion of Barbadians and poverty level among males in the United States with a correlation coefficient (R) of -0.058 and weighted average of 13.6%. Similarly, the statistical analysis conducted on geographies consisting of 460,627,341 people shows a mild positive correlation between the proportion of Eastern Europeans and poverty level among males in the United States with a correlation coefficient (R) of 0.397 and weighted average of 9.6%, a difference of 40.9%.
Male Poverty Correlation Summary
| Measurement | Barbadian | Eastern European |
| Minimum | 1.6% | 0.67% |
| Maximum | 28.7% | 52.0% |
| Range | 27.1% | 51.3% |
| Mean | 12.5% | 11.4% |
| Median | 12.2% | 7.3% |
| Interquartile 25% (IQ1) | 9.2% | 4.3% |
| Interquartile 75% (IQ3) | 14.7% | 13.5% |
| Interquartile Range (IQR) | 5.5% | 9.3% |
| Standard Deviation (Sample) | 5.6% | 11.6% |
| Standard Deviation (Population) | 5.5% | 11.5% |
Similar Demographics by Male Poverty
Demographics Similar to Barbadians by Male Poverty
In terms of male poverty, the demographic groups most similar to Barbadians are Immigrants from Latin America (13.6%, a difference of 0.19%), Bangladeshi (13.6%, a difference of 0.34%), Belizean (13.6%, a difference of 0.44%), Haitian (13.7%, a difference of 0.61%), and Immigrants from West Indies (13.5%, a difference of 0.62%).
| Demographics | Rating | Rank | Male Poverty |
| Sub-Saharan Africans | 0.1 /100 | #268 | Tragic 13.3% |
| Guyanese | 0.0 /100 | #269 | Tragic 13.3% |
| Cree | 0.0 /100 | #270 | Tragic 13.3% |
| Spanish Americans | 0.0 /100 | #271 | Tragic 13.4% |
| Immigrants | Bahamas | 0.0 /100 | #272 | Tragic 13.5% |
| Chickasaw | 0.0 /100 | #273 | Tragic 13.5% |
| Immigrants | West Indies | 0.0 /100 | #274 | Tragic 13.5% |
| Barbadians | 0.0 /100 | #275 | Tragic 13.6% |
| Immigrants | Latin America | 0.0 /100 | #276 | Tragic 13.6% |
| Bangladeshis | 0.0 /100 | #277 | Tragic 13.6% |
| Belizeans | 0.0 /100 | #278 | Tragic 13.6% |
| Haitians | 0.0 /100 | #279 | Tragic 13.7% |
| Mexicans | 0.0 /100 | #280 | Tragic 13.7% |
| Yaqui | 0.0 /100 | #281 | Tragic 13.7% |
| Immigrants | Cabo Verde | 0.0 /100 | #282 | Tragic 13.7% |
Demographics Similar to Eastern Europeans by Male Poverty
In terms of male poverty, the demographic groups most similar to Eastern Europeans are Swedish (9.6%, a difference of 0.14%), Italian (9.6%, a difference of 0.22%), Croatian (9.6%, a difference of 0.23%), Burmese (9.7%, a difference of 0.44%), and Immigrants from Scotland (9.6%, a difference of 0.48%).
| Demographics | Rating | Rank | Male Poverty |
| Lithuanians | 99.8 /100 | #18 | Exceptional 9.5% |
| Immigrants | Hong Kong | 99.7 /100 | #19 | Exceptional 9.6% |
| Latvians | 99.7 /100 | #20 | Exceptional 9.6% |
| Immigrants | Scotland | 99.7 /100 | #21 | Exceptional 9.6% |
| Croatians | 99.7 /100 | #22 | Exceptional 9.6% |
| Italians | 99.7 /100 | #23 | Exceptional 9.6% |
| Swedes | 99.7 /100 | #24 | Exceptional 9.6% |
| Eastern Europeans | 99.6 /100 | #25 | Exceptional 9.6% |
| Burmese | 99.6 /100 | #26 | Exceptional 9.7% |
| Danes | 99.6 /100 | #27 | Exceptional 9.7% |
| Immigrants | Korea | 99.6 /100 | #28 | Exceptional 9.7% |
| Greeks | 99.6 /100 | #29 | Exceptional 9.7% |
| Poles | 99.5 /100 | #30 | Exceptional 9.7% |
| Tongans | 99.5 /100 | #31 | Exceptional 9.7% |
| Macedonians | 99.5 /100 | #32 | Exceptional 9.7% |