Barbadian vs Immigrants Male Poverty
COMPARE
Barbadian
Immigrants
Male Poverty
Male Poverty Comparison
Barbadians
Immigrants
13.6%
MALE POVERTY
0.0/ 100
METRIC RATING
275th/ 347
METRIC RANK
12.0%
MALE POVERTY
4.5/ 100
METRIC RATING
208th/ 347
METRIC RANK
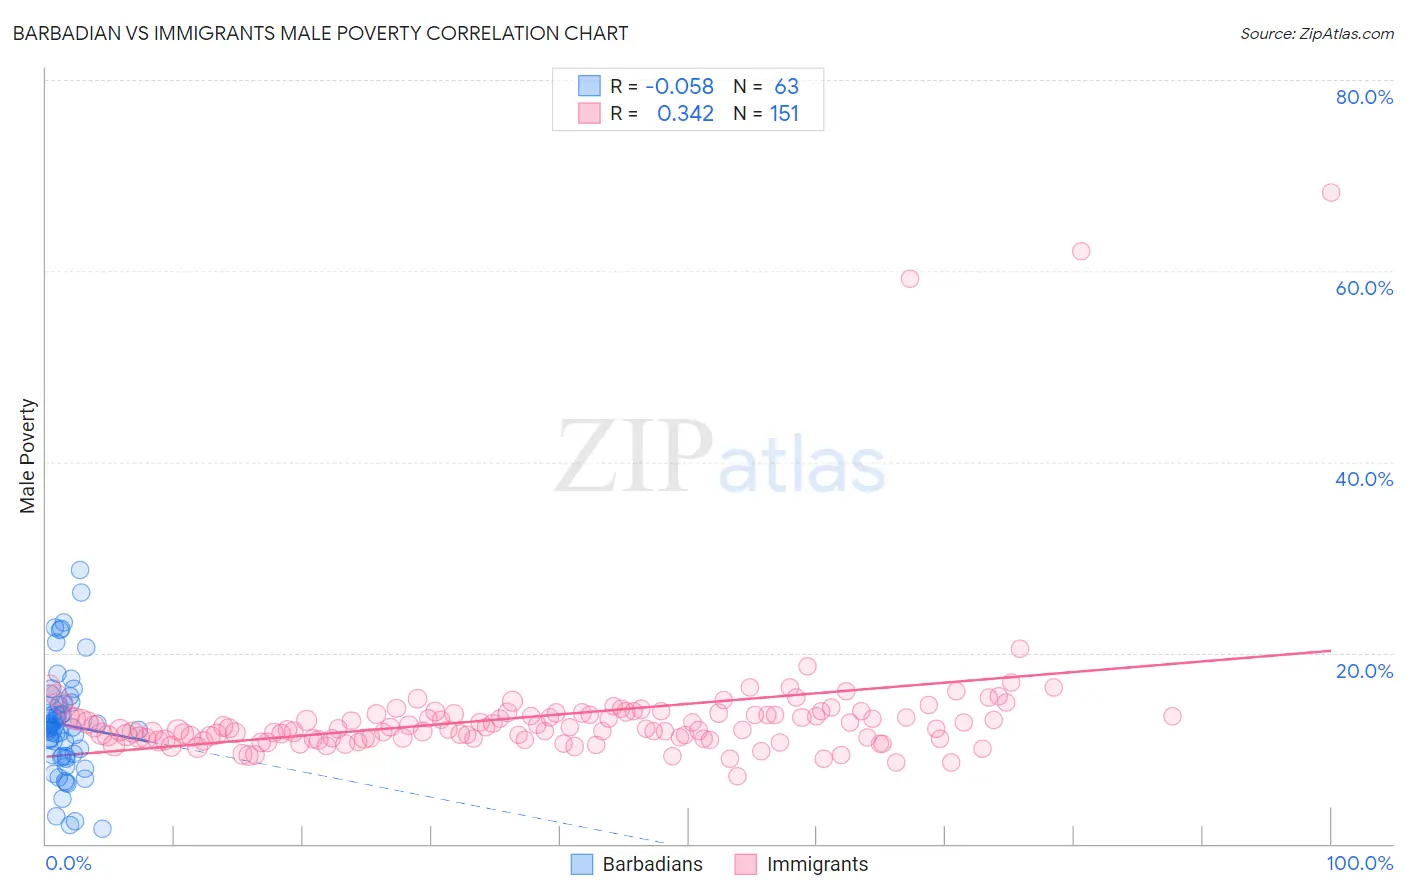
Barbadian vs Immigrants Male Poverty Correlation Chart
The statistical analysis conducted on geographies consisting of 141,266,401 people shows a slight negative correlation between the proportion of Barbadians and poverty level among males in the United States with a correlation coefficient (R) of -0.058 and weighted average of 13.6%. Similarly, the statistical analysis conducted on geographies consisting of 575,955,105 people shows a mild positive correlation between the proportion of Immigrants and poverty level among males in the United States with a correlation coefficient (R) of 0.342 and weighted average of 12.0%, a difference of 13.0%.
Male Poverty Correlation Summary
| Measurement | Barbadian | Immigrants |
| Minimum | 1.6% | 7.0% |
| Maximum | 28.7% | 68.2% |
| Range | 27.1% | 61.1% |
| Mean | 12.5% | 13.4% |
| Median | 12.2% | 12.0% |
| Interquartile 25% (IQ1) | 9.2% | 11.0% |
| Interquartile 75% (IQ3) | 14.7% | 13.6% |
| Interquartile Range (IQR) | 5.5% | 2.6% |
| Standard Deviation (Sample) | 5.6% | 7.4% |
| Standard Deviation (Population) | 5.5% | 7.4% |
Similar Demographics by Male Poverty
Demographics Similar to Barbadians by Male Poverty
In terms of male poverty, the demographic groups most similar to Barbadians are Immigrants from Latin America (13.6%, a difference of 0.19%), Bangladeshi (13.6%, a difference of 0.34%), Belizean (13.6%, a difference of 0.44%), Haitian (13.7%, a difference of 0.61%), and Immigrants from West Indies (13.5%, a difference of 0.62%).
| Demographics | Rating | Rank | Male Poverty |
| Sub-Saharan Africans | 0.1 /100 | #268 | Tragic 13.3% |
| Guyanese | 0.0 /100 | #269 | Tragic 13.3% |
| Cree | 0.0 /100 | #270 | Tragic 13.3% |
| Spanish Americans | 0.0 /100 | #271 | Tragic 13.4% |
| Immigrants | Bahamas | 0.0 /100 | #272 | Tragic 13.5% |
| Chickasaw | 0.0 /100 | #273 | Tragic 13.5% |
| Immigrants | West Indies | 0.0 /100 | #274 | Tragic 13.5% |
| Barbadians | 0.0 /100 | #275 | Tragic 13.6% |
| Immigrants | Latin America | 0.0 /100 | #276 | Tragic 13.6% |
| Bangladeshis | 0.0 /100 | #277 | Tragic 13.6% |
| Belizeans | 0.0 /100 | #278 | Tragic 13.6% |
| Haitians | 0.0 /100 | #279 | Tragic 13.7% |
| Mexicans | 0.0 /100 | #280 | Tragic 13.7% |
| Yaqui | 0.0 /100 | #281 | Tragic 13.7% |
| Immigrants | Cabo Verde | 0.0 /100 | #282 | Tragic 13.7% |
Demographics Similar to Immigrants by Male Poverty
In terms of male poverty, the demographic groups most similar to Immigrants are Immigrants from the Azores (12.0%, a difference of 0.12%), Moroccan (12.0%, a difference of 0.17%), Immigrants from Panama (12.1%, a difference of 0.29%), Malaysian (12.0%, a difference of 0.33%), and Immigrants from Eastern Africa (12.0%, a difference of 0.43%).
| Demographics | Rating | Rank | Male Poverty |
| Spaniards | 13.5 /100 | #201 | Poor 11.7% |
| Aleuts | 10.4 /100 | #202 | Poor 11.8% |
| Immigrants | Western Asia | 9.8 /100 | #203 | Tragic 11.8% |
| Immigrants | Uganda | 8.5 /100 | #204 | Tragic 11.8% |
| Panamanians | 6.2 /100 | #205 | Tragic 11.9% |
| Immigrants | Eastern Africa | 5.4 /100 | #206 | Tragic 12.0% |
| Malaysians | 5.2 /100 | #207 | Tragic 12.0% |
| Immigrants | Immigrants | 4.5 /100 | #208 | Tragic 12.0% |
| Immigrants | Azores | 4.3 /100 | #209 | Tragic 12.0% |
| Moroccans | 4.2 /100 | #210 | Tragic 12.0% |
| Immigrants | Panama | 4.0 /100 | #211 | Tragic 12.1% |
| Americans | 3.2 /100 | #212 | Tragic 12.1% |
| Immigrants | Nonimmigrants | 3.1 /100 | #213 | Tragic 12.1% |
| Japanese | 2.7 /100 | #214 | Tragic 12.2% |
| Immigrants | Uzbekistan | 2.6 /100 | #215 | Tragic 12.2% |