Barbadian vs Immigrants from Netherlands 11th Grade
COMPARE
Barbadian
Immigrants from Netherlands
11th Grade
11th Grade Comparison
Barbadians
Immigrants from Netherlands
90.8%
11TH GRADE
0.0/ 100
METRIC RATING
279th/ 347
METRIC RANK
93.9%
11TH GRADE
99.8/ 100
METRIC RATING
67th/ 347
METRIC RANK
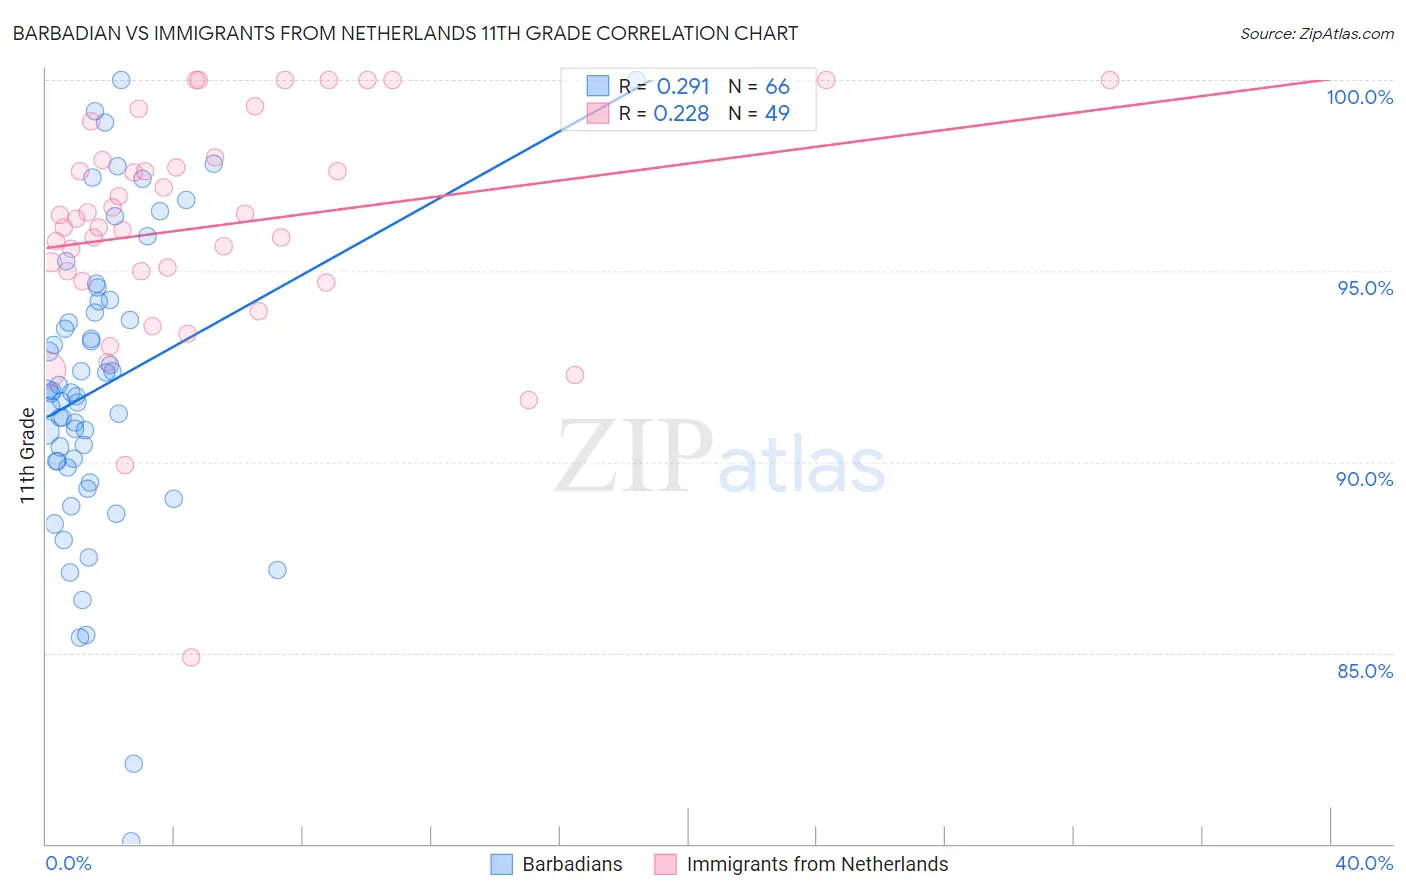
Barbadian vs Immigrants from Netherlands 11th Grade Correlation Chart
The statistical analysis conducted on geographies consisting of 141,304,456 people shows a weak positive correlation between the proportion of Barbadians and percentage of population with at least 11th grade education in the United States with a correlation coefficient (R) of 0.291 and weighted average of 90.8%. Similarly, the statistical analysis conducted on geographies consisting of 237,869,860 people shows a weak positive correlation between the proportion of Immigrants from Netherlands and percentage of population with at least 11th grade education in the United States with a correlation coefficient (R) of 0.228 and weighted average of 93.9%, a difference of 3.5%.
11th Grade Correlation Summary
| Measurement | Barbadian | Immigrants from Netherlands |
| Minimum | 80.1% | 84.9% |
| Maximum | 100.0% | 100.0% |
| Range | 19.9% | 15.1% |
| Mean | 92.0% | 96.2% |
| Median | 91.8% | 96.4% |
| Interquartile 25% (IQ1) | 90.0% | 94.8% |
| Interquartile 75% (IQ3) | 94.2% | 97.9% |
| Interquartile Range (IQR) | 4.2% | 3.1% |
| Standard Deviation (Sample) | 3.9% | 3.0% |
| Standard Deviation (Population) | 3.9% | 3.0% |
Similar Demographics by 11th Grade
Demographics Similar to Barbadians by 11th Grade
In terms of 11th grade, the demographic groups most similar to Barbadians are Malaysian (90.8%, a difference of 0.040%), Sri Lankan (90.7%, a difference of 0.060%), Immigrants from Congo (90.9%, a difference of 0.080%), Bangladeshi (90.9%, a difference of 0.10%), and Dutch West Indian (90.7%, a difference of 0.12%).
| Demographics | Rating | Rank | 11th Grade |
| West Indians | 0.1 /100 | #272 | Tragic 91.0% |
| Paiute | 0.1 /100 | #273 | Tragic 91.0% |
| Immigrants | Trinidad and Tobago | 0.1 /100 | #274 | Tragic 90.9% |
| Immigrants | South Eastern Asia | 0.1 /100 | #275 | Tragic 90.9% |
| Bangladeshis | 0.1 /100 | #276 | Tragic 90.9% |
| Immigrants | Congo | 0.1 /100 | #277 | Tragic 90.9% |
| Malaysians | 0.1 /100 | #278 | Tragic 90.8% |
| Barbadians | 0.0 /100 | #279 | Tragic 90.8% |
| Sri Lankans | 0.0 /100 | #280 | Tragic 90.7% |
| Dutch West Indians | 0.0 /100 | #281 | Tragic 90.7% |
| Immigrants | St. Vincent and the Grenadines | 0.0 /100 | #282 | Tragic 90.7% |
| Immigrants | Barbados | 0.0 /100 | #283 | Tragic 90.7% |
| Immigrants | Laos | 0.0 /100 | #284 | Tragic 90.5% |
| Immigrants | Burma/Myanmar | 0.0 /100 | #285 | Tragic 90.4% |
| Immigrants | West Indies | 0.0 /100 | #286 | Tragic 90.4% |
Demographics Similar to Immigrants from Netherlands by 11th Grade
In terms of 11th grade, the demographic groups most similar to Immigrants from Netherlands are Alaskan Athabascan (93.9%, a difference of 0.0%), Immigrants from Sweden (93.9%, a difference of 0.020%), Native Hawaiian (93.9%, a difference of 0.020%), Zimbabwean (93.9%, a difference of 0.020%), and Scotch-Irish (93.9%, a difference of 0.020%).
| Demographics | Rating | Rank | 11th Grade |
| Okinawans | 99.8 /100 | #60 | Exceptional 94.0% |
| Immigrants | Belgium | 99.8 /100 | #61 | Exceptional 94.0% |
| Austrians | 99.8 /100 | #62 | Exceptional 94.0% |
| Ukrainians | 99.8 /100 | #63 | Exceptional 94.0% |
| Immigrants | Sweden | 99.8 /100 | #64 | Exceptional 93.9% |
| Native Hawaiians | 99.8 /100 | #65 | Exceptional 93.9% |
| Alaskan Athabascans | 99.8 /100 | #66 | Exceptional 93.9% |
| Immigrants | Netherlands | 99.8 /100 | #67 | Exceptional 93.9% |
| Zimbabweans | 99.8 /100 | #68 | Exceptional 93.9% |
| Scotch-Irish | 99.8 /100 | #69 | Exceptional 93.9% |
| Immigrants | England | 99.7 /100 | #70 | Exceptional 93.8% |
| Immigrants | South Africa | 99.7 /100 | #71 | Exceptional 93.8% |
| Immigrants | Japan | 99.7 /100 | #72 | Exceptional 93.8% |
| Romanians | 99.6 /100 | #73 | Exceptional 93.8% |
| Immigrants | Czechoslovakia | 99.6 /100 | #74 | Exceptional 93.8% |