Immigrants from Western Asia vs Albanian Single Mother Poverty
COMPARE
Immigrants from Western Asia
Albanian
Single Mother Poverty
Single Mother Poverty Comparison
Immigrants from Western Asia
Albanians
28.3%
SINGLE MOTHER POVERTY
92.7/ 100
METRIC RATING
114th/ 347
METRIC RANK
27.9%
SINGLE MOTHER POVERTY
97.6/ 100
METRIC RATING
94th/ 347
METRIC RANK
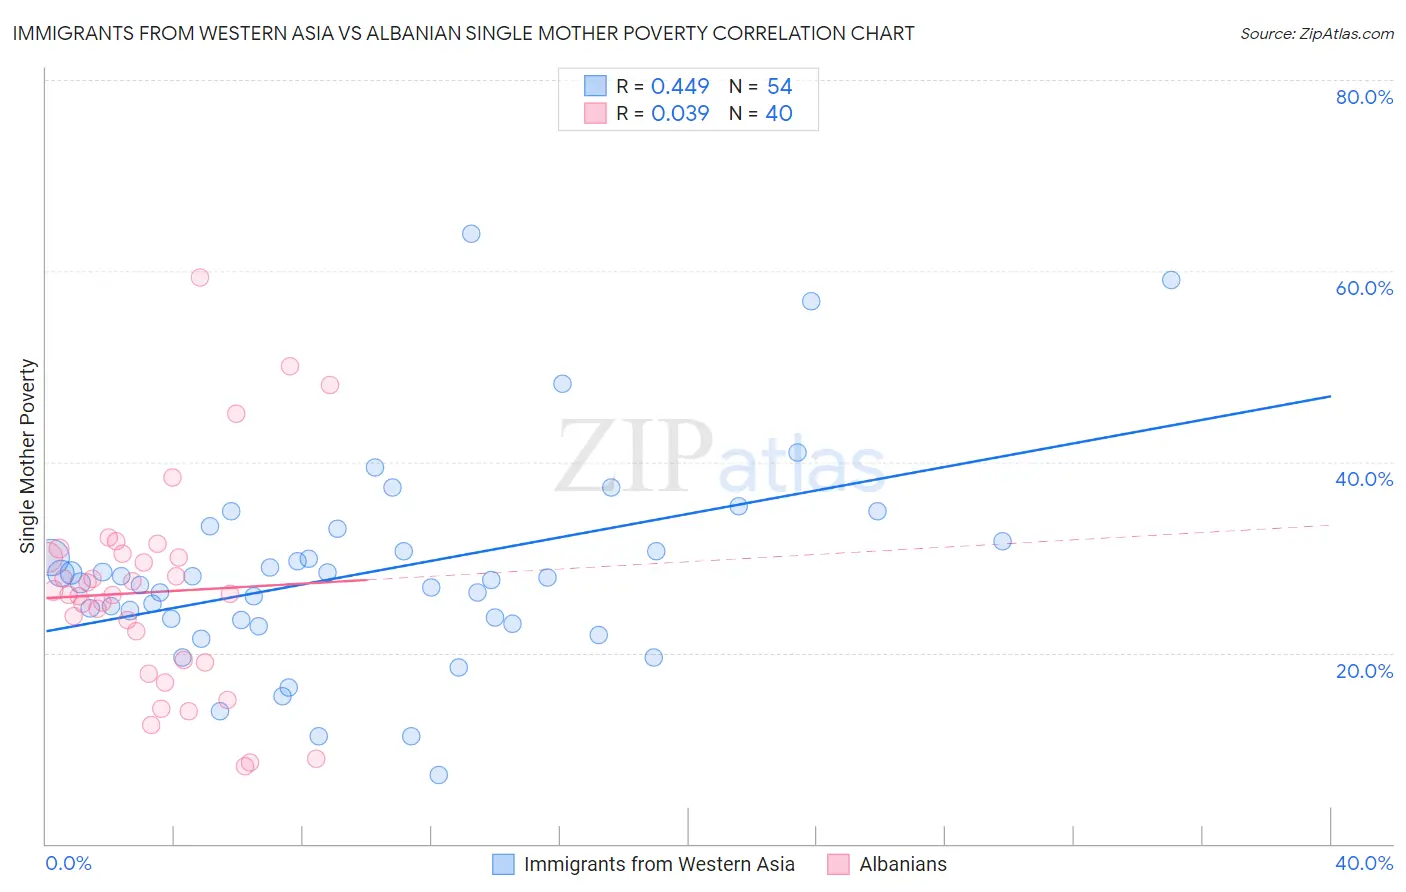
Immigrants from Western Asia vs Albanian Single Mother Poverty Correlation Chart
The statistical analysis conducted on geographies consisting of 393,114,068 people shows a moderate positive correlation between the proportion of Immigrants from Western Asia and poverty level among single mothers in the United States with a correlation coefficient (R) of 0.449 and weighted average of 28.3%. Similarly, the statistical analysis conducted on geographies consisting of 189,512,988 people shows no correlation between the proportion of Albanians and poverty level among single mothers in the United States with a correlation coefficient (R) of 0.039 and weighted average of 27.9%, a difference of 1.5%.
Single Mother Poverty Correlation Summary
| Measurement | Immigrants from Western Asia | Albanian |
| Minimum | 7.2% | 8.1% |
| Maximum | 63.9% | 59.4% |
| Range | 56.7% | 51.3% |
| Mean | 28.6% | 26.4% |
| Median | 27.8% | 26.1% |
| Interquartile 25% (IQ1) | 23.4% | 19.1% |
| Interquartile 75% (IQ3) | 31.6% | 30.2% |
| Interquartile Range (IQR) | 8.2% | 11.1% |
| Standard Deviation (Sample) | 10.8% | 11.0% |
| Standard Deviation (Population) | 10.7% | 10.8% |
Demographics Similar to Immigrants from Western Asia and Albanians by Single Mother Poverty
In terms of single mother poverty, the demographic groups most similar to Immigrants from Western Asia are Immigrants from South Africa (28.3%, a difference of 0.090%), Immigrants from Kazakhstan (28.2%, a difference of 0.37%), Venezuelan (28.2%, a difference of 0.38%), Croatian (28.2%, a difference of 0.43%), and Immigrants from Armenia (28.1%, a difference of 0.56%). Similarly, the demographic groups most similar to Albanians are Chilean (27.9%, a difference of 0.030%), Immigrants from Iraq (27.9%, a difference of 0.13%), Immigrants from Brazil (27.9%, a difference of 0.17%), Immigrants from Nepal (27.9%, a difference of 0.18%), and Immigrants from Netherlands (27.9%, a difference of 0.19%).
| Demographics | Rating | Rank | Single Mother Poverty |
| Albanians | 97.6 /100 | #94 | Exceptional 27.9% |
| Chileans | 97.5 /100 | #95 | Exceptional 27.9% |
| Immigrants | Iraq | 97.3 /100 | #96 | Exceptional 27.9% |
| Immigrants | Brazil | 97.2 /100 | #97 | Exceptional 27.9% |
| Immigrants | Nepal | 97.2 /100 | #98 | Exceptional 27.9% |
| Immigrants | Netherlands | 97.2 /100 | #99 | Exceptional 27.9% |
| Zimbabweans | 97.1 /100 | #100 | Exceptional 27.9% |
| Pakistanis | 96.9 /100 | #101 | Exceptional 28.0% |
| Immigrants | Croatia | 96.7 /100 | #102 | Exceptional 28.0% |
| Immigrants | Northern Africa | 96.6 /100 | #103 | Exceptional 28.0% |
| Italians | 96.6 /100 | #104 | Exceptional 28.0% |
| Israelis | 96.5 /100 | #105 | Exceptional 28.0% |
| Ukrainians | 96.4 /100 | #106 | Exceptional 28.0% |
| Immigrants | Venezuela | 95.8 /100 | #107 | Exceptional 28.1% |
| Immigrants | Zimbabwe | 95.5 /100 | #108 | Exceptional 28.1% |
| Immigrants | Armenia | 95.2 /100 | #109 | Exceptional 28.1% |
| Croatians | 94.8 /100 | #110 | Exceptional 28.2% |
| Venezuelans | 94.5 /100 | #111 | Exceptional 28.2% |
| Immigrants | Kazakhstan | 94.5 /100 | #112 | Exceptional 28.2% |
| Immigrants | South Africa | 93.2 /100 | #113 | Exceptional 28.3% |
| Immigrants | Western Asia | 92.7 /100 | #114 | Exceptional 28.3% |