Barbadian vs Albanian Female Disability
COMPARE
Barbadian
Albanian
Female Disability
Female Disability Comparison
Barbadians
Albanians
12.6%
FEMALE DISABILITY
3.6/ 100
METRIC RATING
239th/ 347
METRIC RANK
12.3%
FEMALE DISABILITY
37.9/ 100
METRIC RATING
180th/ 347
METRIC RANK
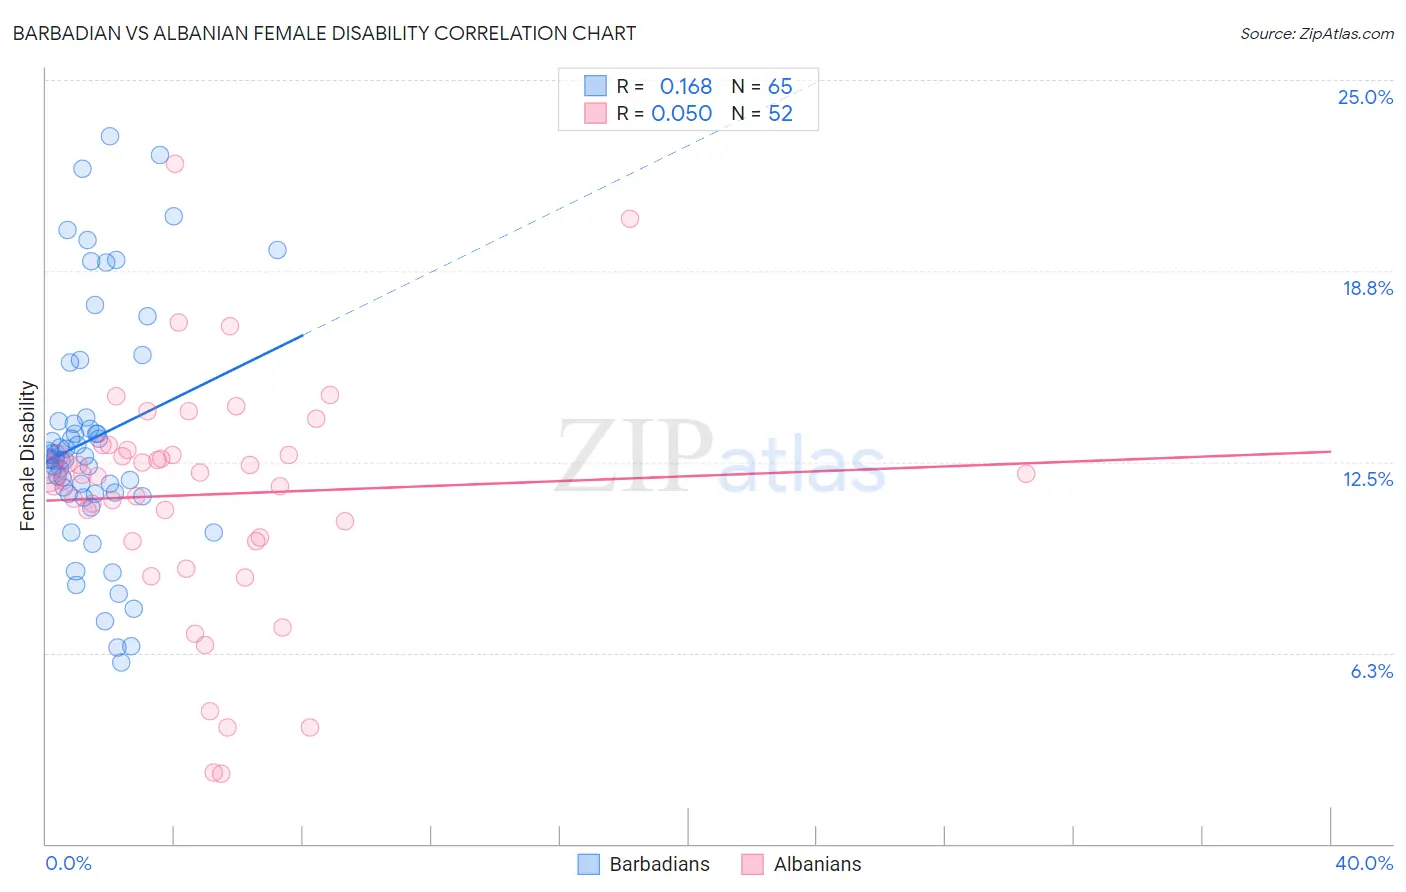
Barbadian vs Albanian Female Disability Correlation Chart
The statistical analysis conducted on geographies consisting of 141,302,135 people shows a poor positive correlation between the proportion of Barbadians and percentage of females with a disability in the United States with a correlation coefficient (R) of 0.168 and weighted average of 12.6%. Similarly, the statistical analysis conducted on geographies consisting of 193,264,096 people shows no correlation between the proportion of Albanians and percentage of females with a disability in the United States with a correlation coefficient (R) of 0.050 and weighted average of 12.3%, a difference of 2.6%.
Female Disability Correlation Summary
| Measurement | Barbadian | Albanian |
| Minimum | 5.9% | 2.3% |
| Maximum | 23.2% | 22.2% |
| Range | 17.2% | 20.0% |
| Mean | 13.3% | 11.4% |
| Median | 12.6% | 12.1% |
| Interquartile 25% (IQ1) | 11.5% | 10.0% |
| Interquartile 75% (IQ3) | 13.9% | 12.8% |
| Interquartile Range (IQR) | 2.4% | 2.8% |
| Standard Deviation (Sample) | 3.9% | 3.9% |
| Standard Deviation (Population) | 3.9% | 3.8% |
Similar Demographics by Female Disability
Demographics Similar to Barbadians by Female Disability
In terms of female disability, the demographic groups most similar to Barbadians are Yugoslavian (12.6%, a difference of 0.030%), Slavic (12.6%, a difference of 0.060%), German Russian (12.6%, a difference of 0.090%), Immigrants from West Indies (12.6%, a difference of 0.19%), and Japanese (12.6%, a difference of 0.26%).
| Demographics | Rating | Rank | Female Disability |
| Immigrants | Somalia | 5.9 /100 | #232 | Tragic 12.5% |
| Immigrants | Iraq | 5.3 /100 | #233 | Tragic 12.5% |
| Scandinavians | 5.3 /100 | #234 | Tragic 12.5% |
| Malaysians | 5.0 /100 | #235 | Tragic 12.5% |
| Immigrants | West Indies | 4.4 /100 | #236 | Tragic 12.6% |
| Slavs | 3.8 /100 | #237 | Tragic 12.6% |
| Yugoslavians | 3.7 /100 | #238 | Tragic 12.6% |
| Barbadians | 3.6 /100 | #239 | Tragic 12.6% |
| German Russians | 3.2 /100 | #240 | Tragic 12.6% |
| Japanese | 2.7 /100 | #241 | Tragic 12.6% |
| Canadians | 2.6 /100 | #242 | Tragic 12.6% |
| Immigrants | Senegal | 2.5 /100 | #243 | Tragic 12.6% |
| Alsatians | 2.5 /100 | #244 | Tragic 12.6% |
| Immigrants | Jamaica | 2.2 /100 | #245 | Tragic 12.6% |
| Spanish American Indians | 2.1 /100 | #246 | Tragic 12.6% |
Demographics Similar to Albanians by Female Disability
In terms of female disability, the demographic groups most similar to Albanians are Immigrants from Fiji (12.3%, a difference of 0.010%), Immigrants from Canada (12.3%, a difference of 0.030%), Norwegian (12.3%, a difference of 0.040%), Cuban (12.3%, a difference of 0.060%), and Iraqi (12.3%, a difference of 0.080%).
| Demographics | Rating | Rank | Female Disability |
| Immigrants | Mexico | 50.8 /100 | #173 | Average 12.2% |
| Immigrants | England | 50.0 /100 | #174 | Average 12.2% |
| Immigrants | St. Vincent and the Grenadines | 49.7 /100 | #175 | Average 12.2% |
| Immigrants | Guyana | 43.1 /100 | #176 | Average 12.2% |
| Immigrants | Ghana | 42.5 /100 | #177 | Average 12.2% |
| Immigrants | Western Europe | 40.9 /100 | #178 | Average 12.2% |
| Immigrants | Fiji | 38.2 /100 | #179 | Fair 12.3% |
| Albanians | 37.9 /100 | #180 | Fair 12.3% |
| Immigrants | Canada | 37.2 /100 | #181 | Fair 12.3% |
| Norwegians | 36.9 /100 | #182 | Fair 12.3% |
| Cubans | 36.5 /100 | #183 | Fair 12.3% |
| Iraqis | 36.0 /100 | #184 | Fair 12.3% |
| Immigrants | Uzbekistan | 33.9 /100 | #185 | Fair 12.3% |
| Austrians | 33.3 /100 | #186 | Fair 12.3% |
| Serbians | 33.1 /100 | #187 | Fair 12.3% |