Choctaw vs Albanian Single Mother Poverty
COMPARE
Choctaw
Albanian
Single Mother Poverty
Single Mother Poverty Comparison
Choctaw
Albanians
36.4%
SINGLE MOTHER POVERTY
0.0/ 100
METRIC RATING
328th/ 347
METRIC RANK
27.9%
SINGLE MOTHER POVERTY
97.6/ 100
METRIC RATING
94th/ 347
METRIC RANK
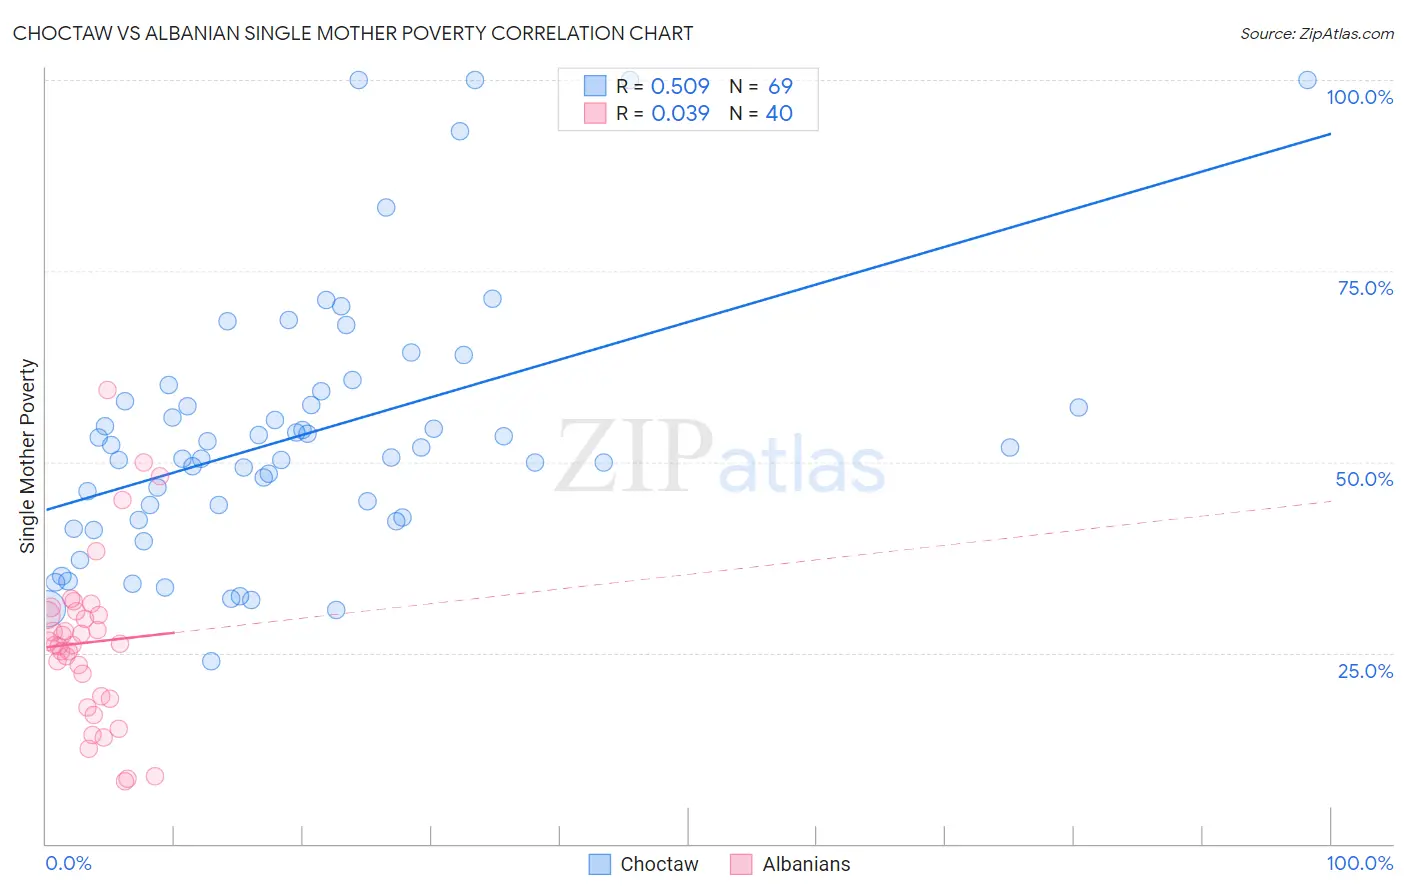
Choctaw vs Albanian Single Mother Poverty Correlation Chart
The statistical analysis conducted on geographies consisting of 266,090,747 people shows a substantial positive correlation between the proportion of Choctaw and poverty level among single mothers in the United States with a correlation coefficient (R) of 0.509 and weighted average of 36.4%. Similarly, the statistical analysis conducted on geographies consisting of 189,512,988 people shows no correlation between the proportion of Albanians and poverty level among single mothers in the United States with a correlation coefficient (R) of 0.039 and weighted average of 27.9%, a difference of 30.6%.
Single Mother Poverty Correlation Summary
| Measurement | Choctaw | Albanian |
| Minimum | 24.0% | 8.1% |
| Maximum | 100.0% | 59.4% |
| Range | 76.0% | 51.3% |
| Mean | 53.6% | 26.4% |
| Median | 51.8% | 26.1% |
| Interquartile 25% (IQ1) | 42.5% | 19.1% |
| Interquartile 75% (IQ3) | 58.6% | 30.2% |
| Interquartile Range (IQR) | 16.1% | 11.1% |
| Standard Deviation (Sample) | 17.1% | 11.0% |
| Standard Deviation (Population) | 17.0% | 10.8% |
Similar Demographics by Single Mother Poverty
Demographics Similar to Choctaw by Single Mother Poverty
In terms of single mother poverty, the demographic groups most similar to Choctaw are Yakama (36.4%, a difference of 0.060%), Apache (36.6%, a difference of 0.48%), Native/Alaskan (36.6%, a difference of 0.58%), Creek (36.7%, a difference of 0.74%), and Dutch West Indian (36.8%, a difference of 0.98%).
| Demographics | Rating | Rank | Single Mother Poverty |
| Paiute | 0.0 /100 | #321 | Tragic 35.1% |
| Blacks/African Americans | 0.0 /100 | #322 | Tragic 35.2% |
| Kiowa | 0.0 /100 | #323 | Tragic 35.5% |
| Ottawa | 0.0 /100 | #324 | Tragic 35.5% |
| Ute | 0.0 /100 | #325 | Tragic 35.7% |
| Seminole | 0.0 /100 | #326 | Tragic 35.8% |
| Yakama | 0.0 /100 | #327 | Tragic 36.4% |
| Choctaw | 0.0 /100 | #328 | Tragic 36.4% |
| Apache | 0.0 /100 | #329 | Tragic 36.6% |
| Natives/Alaskans | 0.0 /100 | #330 | Tragic 36.6% |
| Creek | 0.0 /100 | #331 | Tragic 36.7% |
| Dutch West Indians | 0.0 /100 | #332 | Tragic 36.8% |
| Menominee | 0.0 /100 | #333 | Tragic 37.1% |
| Pueblo | 0.0 /100 | #334 | Tragic 37.2% |
| Yuman | 0.0 /100 | #335 | Tragic 37.8% |
Demographics Similar to Albanians by Single Mother Poverty
In terms of single mother poverty, the demographic groups most similar to Albanians are Chilean (27.9%, a difference of 0.030%), Romanian (27.8%, a difference of 0.10%), Immigrants from Iraq (27.9%, a difference of 0.13%), Immigrants from Brazil (27.9%, a difference of 0.17%), and Immigrants from Nepal (27.9%, a difference of 0.18%).
| Demographics | Rating | Rank | Single Mother Poverty |
| Afghans | 98.5 /100 | #87 | Exceptional 27.7% |
| Ethiopians | 98.4 /100 | #88 | Exceptional 27.7% |
| Immigrants | Ethiopia | 98.4 /100 | #89 | Exceptional 27.7% |
| Immigrants | France | 98.2 /100 | #90 | Exceptional 27.8% |
| Immigrants | Albania | 98.0 /100 | #91 | Exceptional 27.8% |
| Estonians | 97.9 /100 | #92 | Exceptional 27.8% |
| Romanians | 97.8 /100 | #93 | Exceptional 27.8% |
| Albanians | 97.6 /100 | #94 | Exceptional 27.9% |
| Chileans | 97.5 /100 | #95 | Exceptional 27.9% |
| Immigrants | Iraq | 97.3 /100 | #96 | Exceptional 27.9% |
| Immigrants | Brazil | 97.2 /100 | #97 | Exceptional 27.9% |
| Immigrants | Nepal | 97.2 /100 | #98 | Exceptional 27.9% |
| Immigrants | Netherlands | 97.2 /100 | #99 | Exceptional 27.9% |
| Zimbabweans | 97.1 /100 | #100 | Exceptional 27.9% |
| Pakistanis | 96.9 /100 | #101 | Exceptional 28.0% |