Austrian vs Immigrants from Brazil Family Poverty
COMPARE
Austrian
Immigrants from Brazil
Family Poverty
Family Poverty Comparison
Austrians
Immigrants from Brazil
7.8%
FAMILY POVERTY
98.2/ 100
METRIC RATING
73rd/ 347
METRIC RANK
8.5%
FAMILY POVERTY
86.3/ 100
METRIC RATING
136th/ 347
METRIC RANK
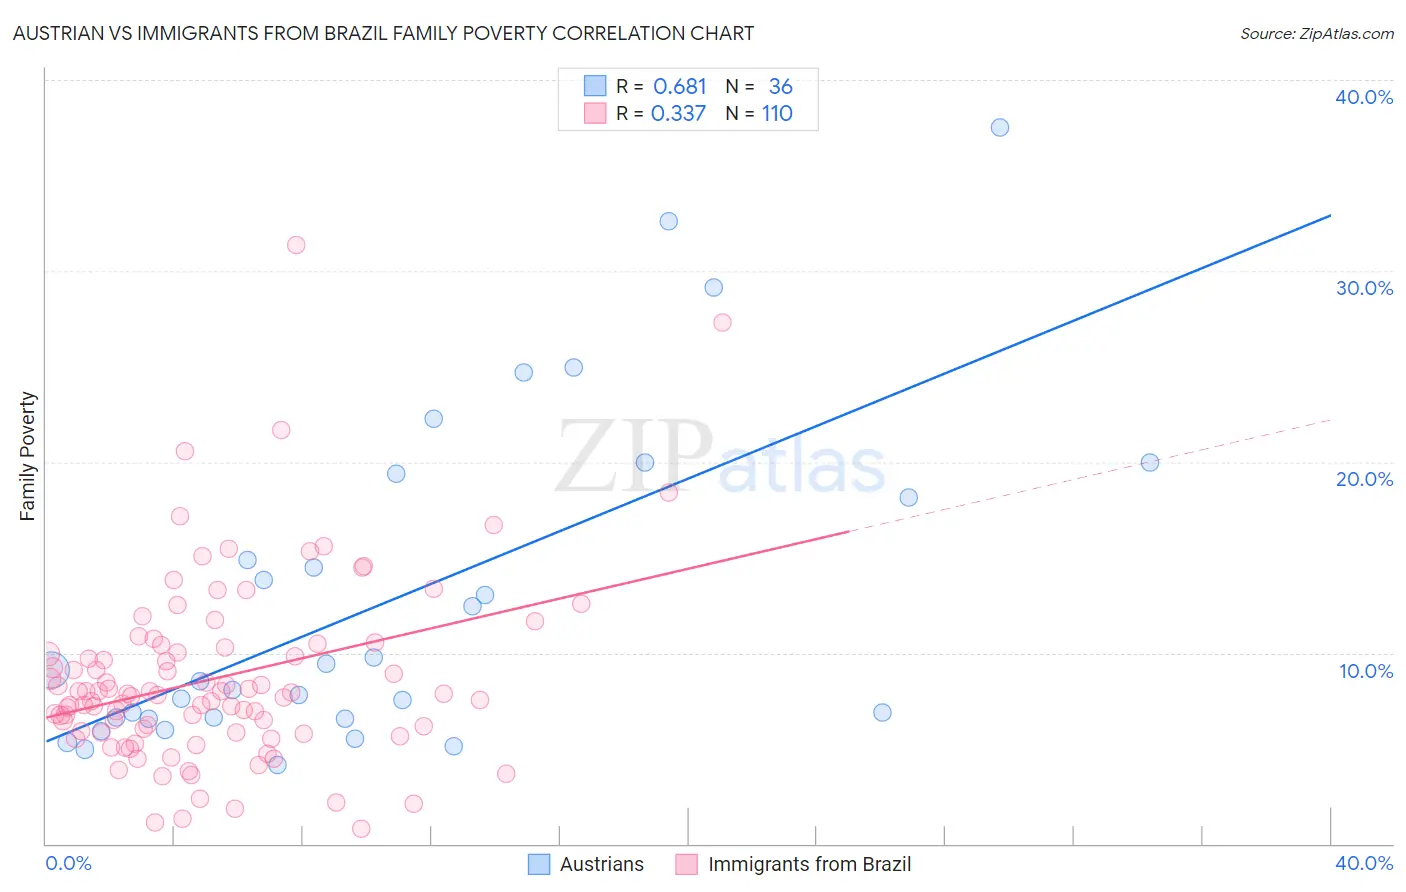
Austrian vs Immigrants from Brazil Family Poverty Correlation Chart
The statistical analysis conducted on geographies consisting of 450,050,339 people shows a significant positive correlation between the proportion of Austrians and poverty level among families in the United States with a correlation coefficient (R) of 0.681 and weighted average of 7.8%. Similarly, the statistical analysis conducted on geographies consisting of 342,227,050 people shows a mild positive correlation between the proportion of Immigrants from Brazil and poverty level among families in the United States with a correlation coefficient (R) of 0.337 and weighted average of 8.5%, a difference of 8.1%.
Family Poverty Correlation Summary
| Measurement | Austrian | Immigrants from Brazil |
| Minimum | 4.1% | 0.81% |
| Maximum | 37.5% | 31.4% |
| Range | 33.4% | 30.6% |
| Mean | 12.8% | 8.7% |
| Median | 8.8% | 7.8% |
| Interquartile 25% (IQ1) | 6.6% | 5.9% |
| Interquartile 75% (IQ3) | 18.8% | 10.3% |
| Interquartile Range (IQR) | 12.2% | 4.4% |
| Standard Deviation (Sample) | 8.6% | 4.9% |
| Standard Deviation (Population) | 8.5% | 4.9% |
Similar Demographics by Family Poverty
Demographics Similar to Austrians by Family Poverty
In terms of family poverty, the demographic groups most similar to Austrians are Immigrants from Romania (7.8%, a difference of 0.0%), Cambodian (7.8%, a difference of 0.060%), Immigrants from China (7.8%, a difference of 0.070%), Immigrants from Canada (7.8%, a difference of 0.080%), and Immigrants from Belgium (7.8%, a difference of 0.13%).
| Demographics | Rating | Rank | Family Poverty |
| Dutch | 98.3 /100 | #66 | Exceptional 7.8% |
| Northern Europeans | 98.3 /100 | #67 | Exceptional 7.8% |
| Australians | 98.2 /100 | #68 | Exceptional 7.8% |
| Immigrants | Belgium | 98.2 /100 | #69 | Exceptional 7.8% |
| Immigrants | Canada | 98.2 /100 | #70 | Exceptional 7.8% |
| Cambodians | 98.2 /100 | #71 | Exceptional 7.8% |
| Immigrants | Romania | 98.2 /100 | #72 | Exceptional 7.8% |
| Austrians | 98.2 /100 | #73 | Exceptional 7.8% |
| Immigrants | China | 98.1 /100 | #74 | Exceptional 7.8% |
| Immigrants | Croatia | 98.1 /100 | #75 | Exceptional 7.8% |
| Immigrants | Latvia | 98.0 /100 | #76 | Exceptional 7.9% |
| Ukrainians | 98.0 /100 | #77 | Exceptional 7.9% |
| Immigrants | North America | 97.9 /100 | #78 | Exceptional 7.9% |
| Immigrants | Europe | 97.8 /100 | #79 | Exceptional 7.9% |
| English | 97.8 /100 | #80 | Exceptional 7.9% |
Demographics Similar to Immigrants from Brazil by Family Poverty
In terms of family poverty, the demographic groups most similar to Immigrants from Brazil are Immigrants from Malaysia (8.5%, a difference of 0.040%), Chilean (8.5%, a difference of 0.080%), Immigrants from Southern Europe (8.5%, a difference of 0.080%), Sri Lankan (8.5%, a difference of 0.090%), and Armenian (8.5%, a difference of 0.48%).
| Demographics | Rating | Rank | Family Poverty |
| Portuguese | 89.2 /100 | #129 | Excellent 8.4% |
| Immigrants | Bosnia and Herzegovina | 88.6 /100 | #130 | Excellent 8.4% |
| Puget Sound Salish | 88.6 /100 | #131 | Excellent 8.4% |
| Immigrants | Argentina | 88.2 /100 | #132 | Excellent 8.4% |
| Sri Lankans | 86.6 /100 | #133 | Excellent 8.5% |
| Chileans | 86.6 /100 | #134 | Excellent 8.5% |
| Immigrants | Malaysia | 86.5 /100 | #135 | Excellent 8.5% |
| Immigrants | Brazil | 86.3 /100 | #136 | Excellent 8.5% |
| Immigrants | Southern Europe | 86.0 /100 | #137 | Excellent 8.5% |
| Armenians | 84.6 /100 | #138 | Excellent 8.5% |
| Immigrants | Nepal | 84.2 /100 | #139 | Excellent 8.5% |
| Immigrants | Kazakhstan | 84.1 /100 | #140 | Excellent 8.5% |
| Immigrants | Ukraine | 83.9 /100 | #141 | Excellent 8.5% |
| Yugoslavians | 83.5 /100 | #142 | Excellent 8.5% |
| Immigrants | Germany | 83.3 /100 | #143 | Excellent 8.5% |