Austrian vs Immigrants from Uganda Female Poverty
COMPARE
Austrian
Immigrants from Uganda
Female Poverty
Female Poverty Comparison
Austrians
Immigrants from Uganda
12.2%
FEMALE POVERTY
97.9/ 100
METRIC RATING
66th/ 347
METRIC RANK
13.7%
FEMALE POVERTY
28.5/ 100
METRIC RATING
198th/ 347
METRIC RANK
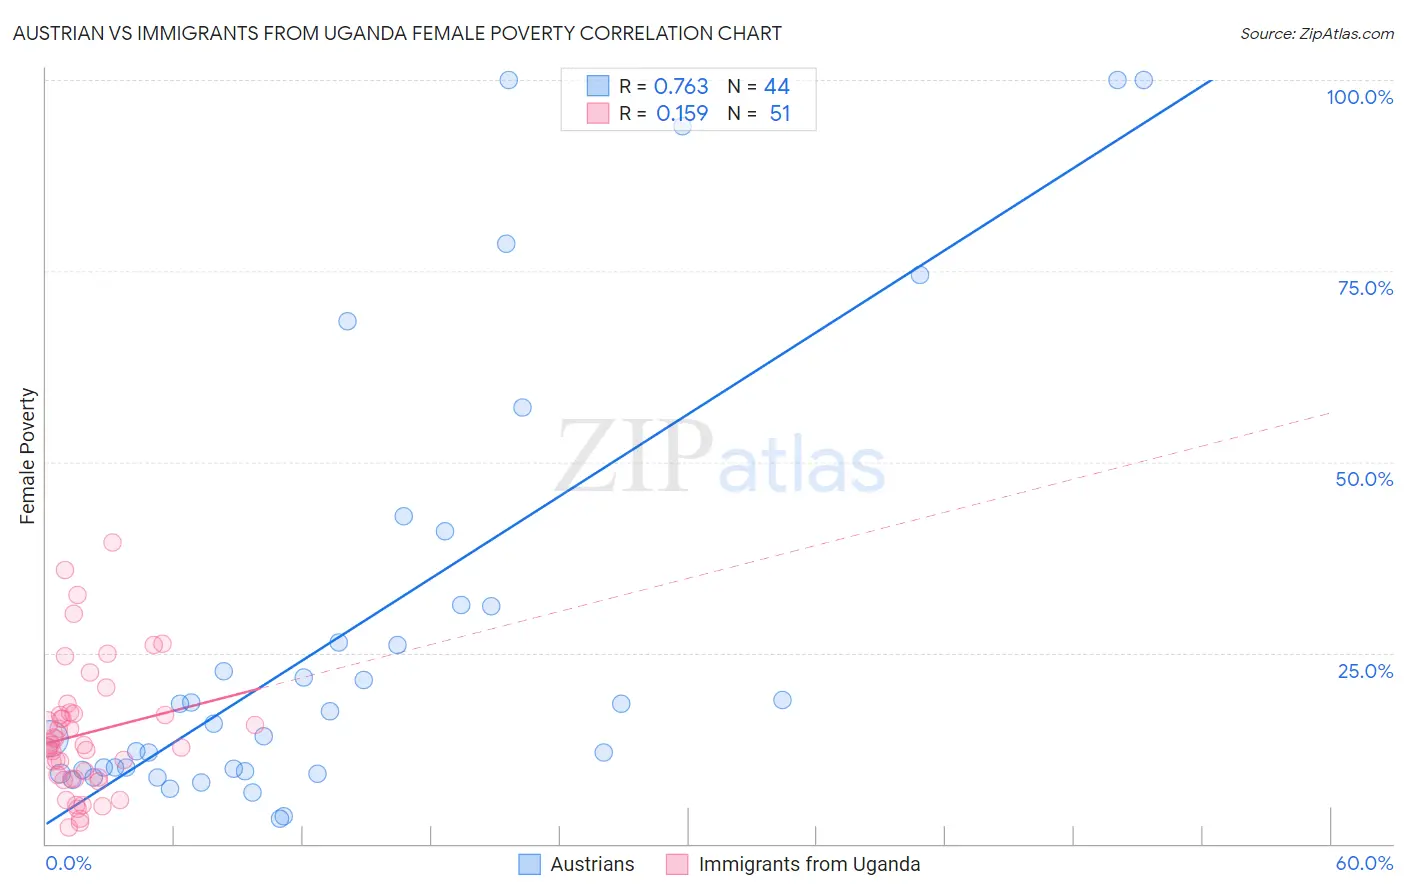
Austrian vs Immigrants from Uganda Female Poverty Correlation Chart
The statistical analysis conducted on geographies consisting of 451,657,404 people shows a strong positive correlation between the proportion of Austrians and poverty level among females in the United States with a correlation coefficient (R) of 0.763 and weighted average of 12.2%. Similarly, the statistical analysis conducted on geographies consisting of 125,969,010 people shows a poor positive correlation between the proportion of Immigrants from Uganda and poverty level among females in the United States with a correlation coefficient (R) of 0.159 and weighted average of 13.7%, a difference of 12.7%.
Female Poverty Correlation Summary
| Measurement | Austrian | Immigrants from Uganda |
| Minimum | 3.3% | 2.1% |
| Maximum | 100.0% | 39.4% |
| Range | 96.7% | 37.3% |
| Mean | 28.2% | 14.4% |
| Median | 16.5% | 12.9% |
| Interquartile 25% (IQ1) | 9.6% | 8.5% |
| Interquartile 75% (IQ3) | 31.2% | 17.0% |
| Interquartile Range (IQR) | 21.6% | 8.5% |
| Standard Deviation (Sample) | 28.8% | 8.4% |
| Standard Deviation (Population) | 28.5% | 8.3% |
Similar Demographics by Female Poverty
Demographics Similar to Austrians by Female Poverty
In terms of female poverty, the demographic groups most similar to Austrians are Indian (Asian) (12.2%, a difference of 0.010%), German (12.2%, a difference of 0.040%), Ukrainian (12.2%, a difference of 0.070%), Immigrants from Eastern Asia (12.2%, a difference of 0.13%), and Immigrants from Italy (12.2%, a difference of 0.15%).
| Demographics | Rating | Rank | Female Poverty |
| Immigrants | Europe | 98.2 /100 | #59 | Exceptional 12.1% |
| Immigrants | Australia | 98.1 /100 | #60 | Exceptional 12.2% |
| Immigrants | Asia | 98.1 /100 | #61 | Exceptional 12.2% |
| Immigrants | Italy | 98.0 /100 | #62 | Exceptional 12.2% |
| Ukrainians | 98.0 /100 | #63 | Exceptional 12.2% |
| Germans | 98.0 /100 | #64 | Exceptional 12.2% |
| Indians (Asian) | 97.9 /100 | #65 | Exceptional 12.2% |
| Austrians | 97.9 /100 | #66 | Exceptional 12.2% |
| Immigrants | Eastern Asia | 97.8 /100 | #67 | Exceptional 12.2% |
| Immigrants | Netherlands | 97.8 /100 | #68 | Exceptional 12.2% |
| Swiss | 97.7 /100 | #69 | Exceptional 12.2% |
| Immigrants | Belgium | 97.7 /100 | #70 | Exceptional 12.2% |
| Carpatho Rusyns | 97.6 /100 | #71 | Exceptional 12.2% |
| Cambodians | 97.5 /100 | #72 | Exceptional 12.2% |
| Zimbabweans | 97.5 /100 | #73 | Exceptional 12.3% |
Demographics Similar to Immigrants from Uganda by Female Poverty
In terms of female poverty, the demographic groups most similar to Immigrants from Uganda are Arab (13.7%, a difference of 0.010%), South American Indian (13.7%, a difference of 0.060%), Immigrants from South America (13.7%, a difference of 0.25%), Delaware (13.7%, a difference of 0.30%), and Immigrants from Lebanon (13.8%, a difference of 0.34%).
| Demographics | Rating | Rank | Female Poverty |
| Immigrants | Kuwait | 32.7 /100 | #191 | Fair 13.7% |
| Immigrants | Costa Rica | 31.9 /100 | #192 | Fair 13.7% |
| Iraqis | 31.8 /100 | #193 | Fair 13.7% |
| Delaware | 31.1 /100 | #194 | Fair 13.7% |
| Immigrants | South America | 30.6 /100 | #195 | Fair 13.7% |
| South American Indians | 28.9 /100 | #196 | Fair 13.7% |
| Arabs | 28.6 /100 | #197 | Fair 13.7% |
| Immigrants | Uganda | 28.5 /100 | #198 | Fair 13.7% |
| Immigrants | Lebanon | 25.6 /100 | #199 | Fair 13.8% |
| Spanish | 21.4 /100 | #200 | Fair 13.9% |
| Immigrants | Kenya | 21.1 /100 | #201 | Fair 13.9% |
| Hmong | 21.1 /100 | #202 | Fair 13.9% |
| Immigrants | Western Asia | 20.7 /100 | #203 | Fair 13.9% |
| Spaniards | 18.9 /100 | #204 | Poor 13.9% |
| Ugandans | 15.4 /100 | #205 | Poor 14.0% |