Austrian vs Ethiopian Female Poverty

COMPARE

Austrian
Race
Ancestry
AfghanAfricanAlaska NativeAlaskan AthabascanAlbanianAleutAlsatianAmericanApacheArabArapahoArgentineanArmenianAssyrian/Chaldean/SyriacAustralianAustrianBahamianBangladeshiBarbadianBasqueBelgianBelizeanBermudanBhutaneseBlackfeetBolivianBrazilianBritishBritish West IndianBulgarianBurmeseCajunCambodianCanadianCape VerdeanCarpatho RusynCelticCentral AmericanCentral American IndianCherokeeCheyenneChickasawChileanChineseChippewaChoctawColombianColvilleComancheCosta RicanCreeCreekCroatianCrowCubanCypriotCzechCzechoslovakianDanishDelawareDominicanDutchDutch West IndianEastern EuropeanEcuadorianEgyptianEnglishEstonianEuropeanFijianFilipinoFinnishFrenchFrench American IndianFrench CanadianGermanGerman RussianGhanaianGreekGuamanian/ChamorroGuatemalanGuyaneseHaitianHmongHonduranHopiHoumaHungarianIcelanderIndian (Asian)IndonesianInupiatIranianIraqiIrishIroquoisIsraeliItalianJamaicanJapaneseJordanianKenyanKiowaKoreanLaotianLatvianLebaneseLiberianLithuanianLumbeeLuxembourgerMacedonianMalaysianMalteseMarshalleseMenomineeMexicanMexican American IndianMongolianMoroccanNative HawaiianNavajoNepaleseNew ZealanderNicaraguanNigerianNorthern EuropeanNorwegianOkinawanOsageOttawaPaiutePakistaniPalestinianPanamanianParaguayanPennsylvania GermanPeruvianPimaPolishPortuguesePotawatomiPuebloPuerto RicanPuget Sound SalishRomanianRussianSalvadoranSamoanScandinavianScotch-IrishScottishSeminoleSenegaleseSerbianShoshoneSierra LeoneanSiouxSlavicSlovakSloveneSomaliSouth AfricanSouth AmericanSouth American IndianSoviet UnionSpaniardSpanishSpanish AmericanSpanish American IndianSri LankanSubsaharan AfricanSudaneseSwedishSwissSyrianTaiwaneseThaiTlingit-HaidaTohono O'OdhamTonganTrinidadian and TobagonianTsimshianTurkishU.S. Virgin IslanderUgandanUkrainianUruguayanUteVenezuelanVietnameseWelshWest IndianYakamaYaquiYugoslavianYumanYup'ikZimbabwean
Immigration
NonimmigrantsImmigrantsAfghanistanAfricaAlbaniaArgentinaArmeniaAsiaAustraliaAustriaBahamasBangladeshBarbadosBelarusBelgiumBelizeBoliviaBosnia and HerzegovinaBrazilBulgariaBurma/MyanmarCabo VerdeCambodiaCameroonCanadaCaribbeanCentral AmericaChileChinaColombiaCongoCosta RicaCroatiaCubaCzechoslovakiaDenmarkDominicaDominican RepublicEastern AfricaEastern AsiaEastern EuropeEcuadorEgyptEl SalvadorEnglandEritreaEthiopiaEuropeFijiFranceGermanyGhanaGreeceGrenadaGuatemalaGuyanaHaitiHondurasHong KongHungaryIndiaIndonesiaIranIraqIrelandIsraelItalyJamaicaJapanJordanKazakhstanKenyaKoreaKuwaitLaosLatin AmericaLatviaLebanonLiberiaLithuaniaMalaysiaMexicoMicronesiaMiddle AfricaMoldovaMoroccoNepalNetherlandsNicaraguaNigeriaNorth AmericaNorth MacedoniaNorthern AfricaNorthern EuropeNorwayOceaniaPakistanPanamaPeruPhilippinesPolandPortugalRomaniaRussiaSaudi ArabiaScotlandSenegalSerbiaSierra LeoneSingaporeSomaliaSouth AfricaSouth AmericaSouth Central AsiaSouth Eastern AsiaSouthern EuropeSpainSri LankaSt. Vincent and the GrenadinesSudanSwedenSwitzerlandSyriaTaiwanThailandTrinidad and TobagoTurkeyUgandaUkraineUruguayUzbekistanVenezuelaVietnamWest IndiesWestern AfricaWestern AsiaWestern EuropeYemenZaireZimbabweAzores
Ethiopian
Race
Ancestry
AfghanAfricanAlaska NativeAlaskan AthabascanAlbanianAleutAlsatianAmericanApacheArabArapahoArgentineanArmenianAssyrian/Chaldean/SyriacAustralianBahamianBangladeshiBarbadianBasqueBelgianBelizeanBermudanBhutaneseBlackfeetBolivianBrazilianBritishBritish West IndianBulgarianBurmeseCajunCambodianCanadianCape VerdeanCarpatho RusynCelticCentral AmericanCentral American IndianCherokeeCheyenneChickasawChileanChineseChippewaChoctawColombianColvilleComancheCosta RicanCreeCreekCroatianCrowCubanCypriotCzechCzechoslovakianDanishDelawareDominicanDutchDutch West IndianEastern EuropeanEcuadorianEgyptianEnglishEstonianEthiopianEuropeanFijianFilipinoFinnishFrenchFrench American IndianFrench CanadianGermanGerman RussianGhanaianGreekGuamanian/ChamorroGuatemalanGuyaneseHaitianHmongHonduranHopiHoumaHungarianIcelanderIndian (Asian)IndonesianInupiatIranianIraqiIrishIroquoisIsraeliItalianJamaicanJapaneseJordanianKenyanKiowaKoreanLaotianLatvianLebaneseLiberianLithuanianLumbeeLuxembourgerMacedonianMalaysianMalteseMarshalleseMenomineeMexicanMexican American IndianMongolianMoroccanNative HawaiianNavajoNepaleseNew ZealanderNicaraguanNigerianNorthern EuropeanNorwegianOkinawanOsageOttawaPaiutePakistaniPalestinianPanamanianParaguayanPennsylvania GermanPeruvianPimaPolishPortuguesePotawatomiPuebloPuerto RicanPuget Sound SalishRomanianRussianSalvadoranSamoanScandinavianScotch-IrishScottishSeminoleSenegaleseSerbianShoshoneSierra LeoneanSiouxSlavicSlovakSloveneSomaliSouth AfricanSouth AmericanSouth American IndianSoviet UnionSpaniardSpanishSpanish AmericanSpanish American IndianSri LankanSubsaharan AfricanSudaneseSwedishSwissSyrianTaiwaneseThaiTlingit-HaidaTohono O'OdhamTonganTrinidadian and TobagonianTsimshianTurkishU.S. Virgin IslanderUgandanUkrainianUruguayanUteVenezuelanVietnameseWelshWest IndianYakamaYaquiYugoslavianYumanYup'ikZimbabwean
Immigration
NonimmigrantsImmigrantsAfghanistanAfricaAlbaniaArgentinaArmeniaAsiaAustraliaAustriaBahamasBangladeshBarbadosBelarusBelgiumBelizeBoliviaBosnia and HerzegovinaBrazilBulgariaBurma/MyanmarCabo VerdeCambodiaCameroonCanadaCaribbeanCentral AmericaChileChinaColombiaCongoCosta RicaCroatiaCubaCzechoslovakiaDenmarkDominicaDominican RepublicEastern AfricaEastern AsiaEastern EuropeEcuadorEgyptEl SalvadorEnglandEritreaEthiopiaEuropeFijiFranceGermanyGhanaGreeceGrenadaGuatemalaGuyanaHaitiHondurasHong KongHungaryIndiaIndonesiaIranIraqIrelandIsraelItalyJamaicaJapanJordanKazakhstanKenyaKoreaKuwaitLaosLatin AmericaLatviaLebanonLiberiaLithuaniaMalaysiaMexicoMicronesiaMiddle AfricaMoldovaMoroccoNepalNetherlandsNicaraguaNigeriaNorth AmericaNorth MacedoniaNorthern AfricaNorthern EuropeNorwayOceaniaPakistanPanamaPeruPhilippinesPolandPortugalRomaniaRussiaSaudi ArabiaScotlandSenegalSerbiaSierra LeoneSingaporeSomaliaSouth AfricaSouth AmericaSouth Central AsiaSouth Eastern AsiaSouthern EuropeSpainSri LankaSt. Vincent and the GrenadinesSudanSwedenSwitzerlandSyriaTaiwanThailandTrinidad and TobagoTurkeyUgandaUkraineUruguayUzbekistanVenezuelaVietnamWest IndiesWestern AfricaWestern AsiaWestern EuropeYemenZaireZimbabweAzores
Female Poverty
Income
Poverty
Unemployment
Labor Participation
Family Structure
Vehicle Availability
Education Level
Disability

Female Poverty Comparison

Austrians

Ethiopians

Exceptional
Good
12.2%
FEMALE POVERTY
97.9/ 100
METRIC RATING
66th/ 347
METRIC RANK
13.3%
FEMALE POVERTY
62.3/ 100
METRIC RATING
164th/ 347
METRIC RANK

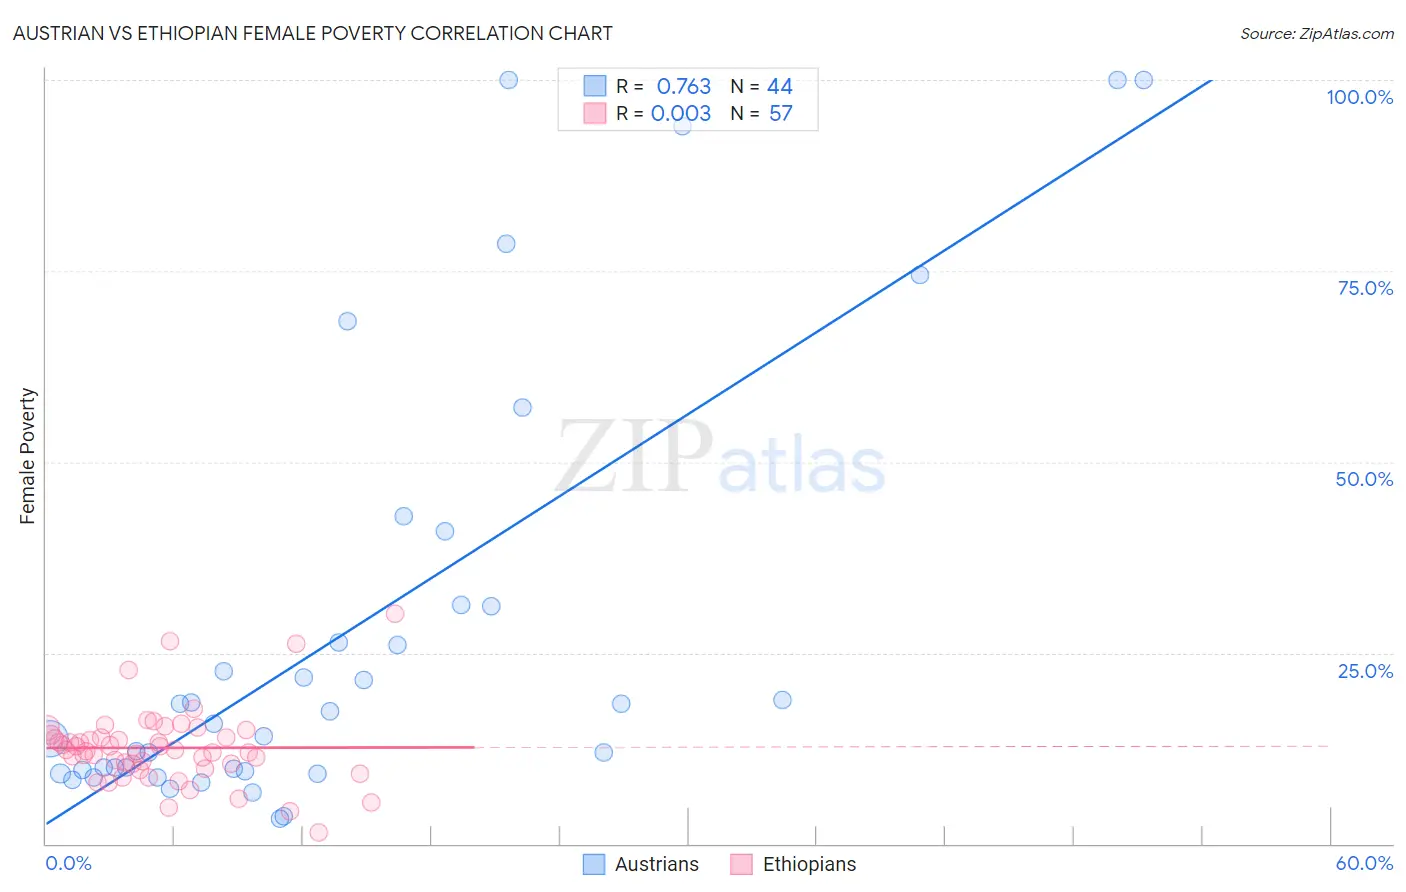
Austrian vs Ethiopian Female Poverty Correlation Chart

The statistical analysis conducted on geographies consisting of 451,657,404 people shows a strong positive correlation between the proportion of Austrians and poverty level among females in the United States with a correlation coefficient (R) of 0.763 and weighted average of 12.2%. Similarly, the statistical analysis conducted on geographies consisting of 223,083,750 people shows no correlation between the proportion of Ethiopians and poverty level among females in the United States with a correlation coefficient (R) of 0.003 and weighted average of 13.3%, a difference of 8.9%.
Austrian vs Ethiopian Female Poverty

Female Poverty Correlation Summary

MeasurementAustrianEthiopian
Minimum3.3%1.5%
Maximum100.0%30.1%
Range96.7%28.6%
Mean28.2%12.6%
Median16.5%12.2%
Interquartile 25% (IQ1)9.6%10.1%
Interquartile 75% (IQ3)31.2%14.1%
Interquartile Range (IQR)21.6%4.0%
Standard Deviation (Sample)28.8%5.0%
Standard Deviation (Population)28.5%5.0%

Similar Demographics by Female Poverty

Demographics Similar to Austrians by Female Poverty

In terms of female poverty, the demographic groups most similar to Austrians are Indian (Asian) (12.2%, a difference of 0.010%), German (12.2%, a difference of 0.040%), Ukrainian (12.2%, a difference of 0.070%), Immigrants from Eastern Asia (12.2%, a difference of 0.13%), and Immigrants from Italy (12.2%, a difference of 0.15%).
DemographicsRating | RankFemale Poverty
Immigrants | Europe
98.2
/100
|
#59
Exceptional
12.1%
Immigrants | Australia
98.1
/100
|
#60
Exceptional
12.2%
Immigrants | Asia
98.1
/100
|
#61
Exceptional
12.2%
Immigrants | Italy
98.0
/100
|
#62
Exceptional
12.2%
Ukrainians
98.0
/100
|
#63
Exceptional
12.2%
Germans
98.0
/100
|
#64
Exceptional
12.2%
Indians (Asian)
97.9
/100
|
#65
Exceptional
12.2%
Austrians
97.9
/100
|
#66
Exceptional
12.2%
Immigrants | Eastern Asia
97.8
/100
|
#67
Exceptional
12.2%
Immigrants | Netherlands
97.8
/100
|
#68
Exceptional
12.2%
Swiss
97.7
/100
|
#69
Exceptional
12.2%
Immigrants | Belgium
97.7
/100
|
#70
Exceptional
12.2%
Carpatho Rusyns
97.6
/100
|
#71
Exceptional
12.2%
Cambodians
97.5
/100
|
#72
Exceptional
12.2%
Zimbabweans
97.5
/100
|
#73
Exceptional
12.3%

Demographics Similar to Ethiopians by Female Poverty

In terms of female poverty, the demographic groups most similar to Ethiopians are Guamanian/Chamorro (13.3%, a difference of 0.010%), Immigrants from Albania (13.3%, a difference of 0.010%), Immigrants from Ethiopia (13.3%, a difference of 0.020%), Scotch-Irish (13.3%, a difference of 0.020%), and Immigrants from Nepal (13.3%, a difference of 0.050%).
DemographicsRating | RankFemale Poverty
Immigrants | Northern Africa
68.8
/100
|
#157
Good
13.2%
Pennsylvania Germans
67.3
/100
|
#158
Good
13.2%
Costa Ricans
63.6
/100
|
#159
Good
13.3%
Immigrants | Nepal
62.7
/100
|
#160
Good
13.3%
Immigrants | Ethiopia
62.5
/100
|
#161
Good
13.3%
Guamanians/Chamorros
62.4
/100
|
#162
Good
13.3%
Immigrants | Albania
62.4
/100
|
#163
Good
13.3%
Ethiopians
62.3
/100
|
#164
Good
13.3%
Scotch-Irish
62.1
/100
|
#165
Good
13.3%
Immigrants | Oceania
59.7
/100
|
#166
Average
13.3%
Immigrants | Chile
57.4
/100
|
#167
Average
13.3%
Aleuts
56.7
/100
|
#168
Average
13.4%
Lebanese
55.9
/100
|
#169
Average
13.4%
Colombians
55.7
/100
|
#170
Average
13.4%
Whites/Caucasians
54.6
/100
|
#171
Average
13.4%