Austrian vs Immigrants from Eastern Europe Female Poverty
COMPARE
Austrian
Immigrants from Eastern Europe
Female Poverty
Female Poverty Comparison
Austrians
Immigrants from Eastern Europe
12.2%
FEMALE POVERTY
97.9/ 100
METRIC RATING
66th/ 347
METRIC RANK
12.3%
FEMALE POVERTY
97.2/ 100
METRIC RATING
76th/ 347
METRIC RANK
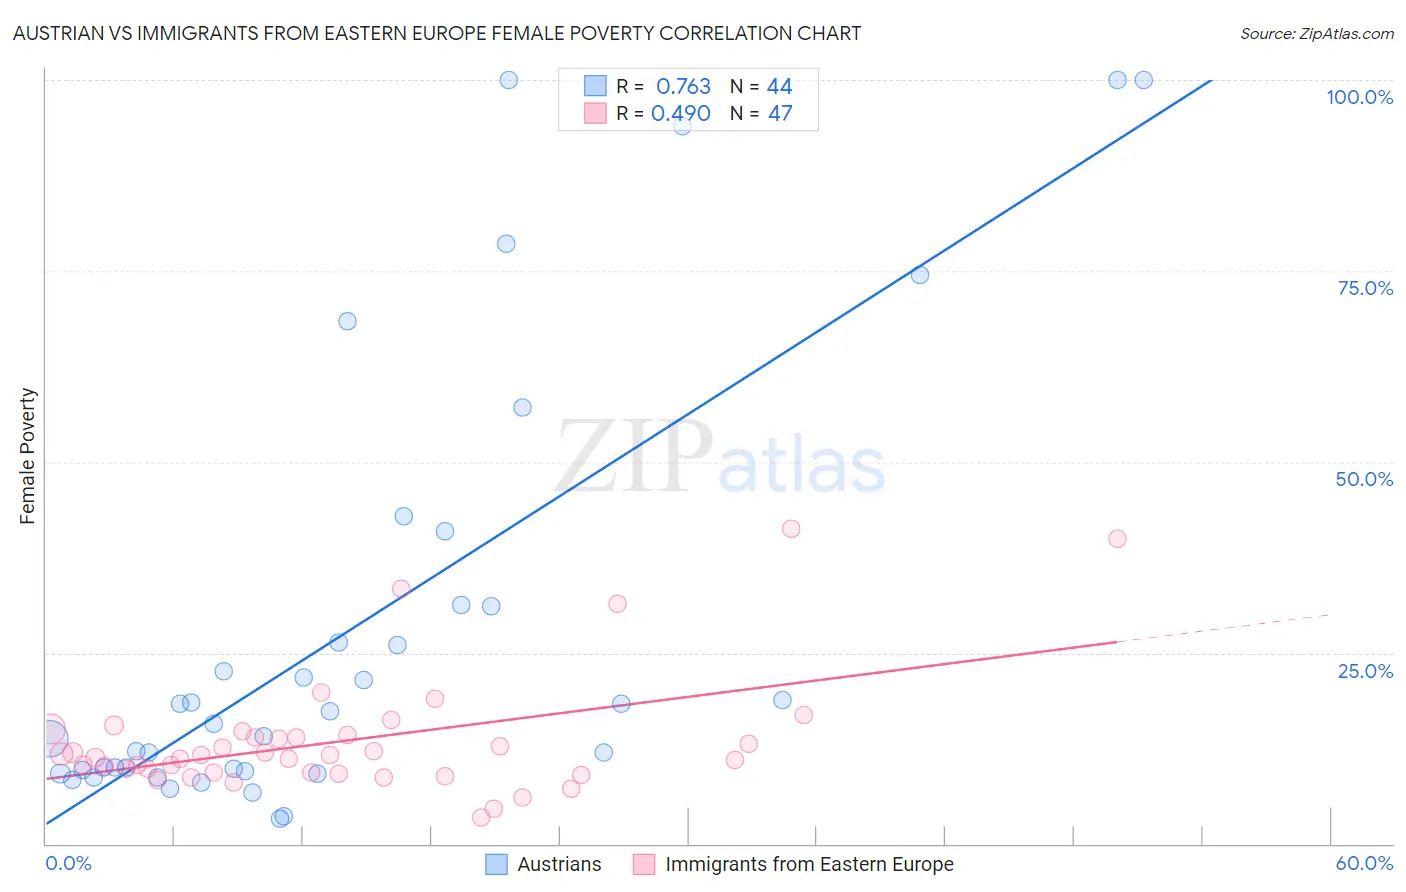
Austrian vs Immigrants from Eastern Europe Female Poverty Correlation Chart
The statistical analysis conducted on geographies consisting of 451,657,404 people shows a strong positive correlation between the proportion of Austrians and poverty level among females in the United States with a correlation coefficient (R) of 0.763 and weighted average of 12.2%. Similarly, the statistical analysis conducted on geographies consisting of 475,295,788 people shows a moderate positive correlation between the proportion of Immigrants from Eastern Europe and poverty level among females in the United States with a correlation coefficient (R) of 0.490 and weighted average of 12.3%, a difference of 0.78%.
Female Poverty Correlation Summary
| Measurement | Austrian | Immigrants from Eastern Europe |
| Minimum | 3.3% | 3.4% |
| Maximum | 100.0% | 41.3% |
| Range | 96.7% | 37.9% |
| Mean | 28.2% | 13.5% |
| Median | 16.5% | 11.6% |
| Interquartile 25% (IQ1) | 9.6% | 9.3% |
| Interquartile 75% (IQ3) | 31.2% | 14.3% |
| Interquartile Range (IQR) | 21.6% | 5.0% |
| Standard Deviation (Sample) | 28.8% | 7.9% |
| Standard Deviation (Population) | 28.5% | 7.8% |
Demographics Similar to Austrians and Immigrants from Eastern Europe by Female Poverty
In terms of female poverty, the demographic groups most similar to Austrians are Indian (Asian) (12.2%, a difference of 0.010%), German (12.2%, a difference of 0.040%), Ukrainian (12.2%, a difference of 0.070%), Immigrants from Eastern Asia (12.2%, a difference of 0.13%), and Immigrants from Italy (12.2%, a difference of 0.15%). Similarly, the demographic groups most similar to Immigrants from Eastern Europe are Serbian (12.3%, a difference of 0.030%), Egyptian (12.3%, a difference of 0.040%), Immigrants from North America (12.3%, a difference of 0.11%), Slovak (12.3%, a difference of 0.16%), and Immigrants from Sweden (12.3%, a difference of 0.16%).
| Demographics | Rating | Rank | Female Poverty |
| Immigrants | Asia | 98.1 /100 | #61 | Exceptional 12.2% |
| Immigrants | Italy | 98.0 /100 | #62 | Exceptional 12.2% |
| Ukrainians | 98.0 /100 | #63 | Exceptional 12.2% |
| Germans | 98.0 /100 | #64 | Exceptional 12.2% |
| Indians (Asian) | 97.9 /100 | #65 | Exceptional 12.2% |
| Austrians | 97.9 /100 | #66 | Exceptional 12.2% |
| Immigrants | Eastern Asia | 97.8 /100 | #67 | Exceptional 12.2% |
| Immigrants | Netherlands | 97.8 /100 | #68 | Exceptional 12.2% |
| Swiss | 97.7 /100 | #69 | Exceptional 12.2% |
| Immigrants | Belgium | 97.7 /100 | #70 | Exceptional 12.2% |
| Carpatho Rusyns | 97.6 /100 | #71 | Exceptional 12.2% |
| Cambodians | 97.5 /100 | #72 | Exceptional 12.2% |
| Zimbabweans | 97.5 /100 | #73 | Exceptional 12.3% |
| Immigrants | Canada | 97.5 /100 | #74 | Exceptional 12.3% |
| Europeans | 97.4 /100 | #75 | Exceptional 12.3% |
| Immigrants | Eastern Europe | 97.2 /100 | #76 | Exceptional 12.3% |
| Serbians | 97.2 /100 | #77 | Exceptional 12.3% |
| Egyptians | 97.2 /100 | #78 | Exceptional 12.3% |
| Immigrants | North America | 97.1 /100 | #79 | Exceptional 12.3% |
| Slovaks | 97.1 /100 | #80 | Exceptional 12.3% |
| Immigrants | Sweden | 97.1 /100 | #81 | Exceptional 12.3% |