Austrian vs Immigrants from Armenia Male Poverty
COMPARE
Austrian
Immigrants from Armenia
Male Poverty
Male Poverty Comparison
Austrians
Immigrants from Armenia
10.1%
MALE POVERTY
97.8/ 100
METRIC RATING
61st/ 347
METRIC RANK
12.6%
MALE POVERTY
0.6/ 100
METRIC RATING
234th/ 347
METRIC RANK
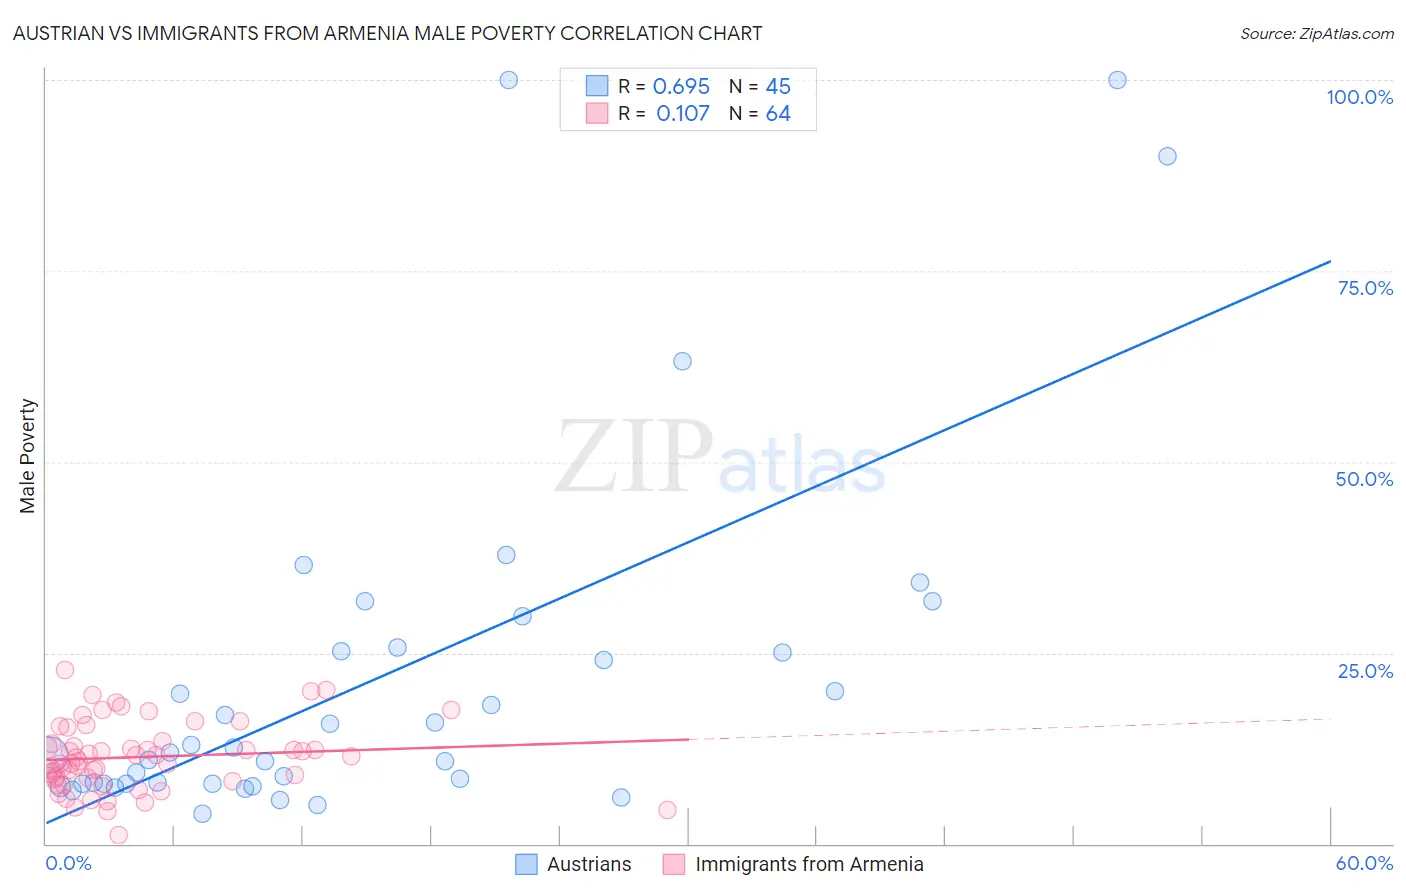
Austrian vs Immigrants from Armenia Male Poverty Correlation Chart
The statistical analysis conducted on geographies consisting of 451,474,043 people shows a significant positive correlation between the proportion of Austrians and poverty level among males in the United States with a correlation coefficient (R) of 0.695 and weighted average of 10.1%. Similarly, the statistical analysis conducted on geographies consisting of 97,715,591 people shows a poor positive correlation between the proportion of Immigrants from Armenia and poverty level among males in the United States with a correlation coefficient (R) of 0.107 and weighted average of 12.6%, a difference of 24.2%.
Male Poverty Correlation Summary
| Measurement | Austrian | Immigrants from Armenia |
| Minimum | 4.0% | 1.2% |
| Maximum | 100.0% | 22.8% |
| Range | 96.0% | 21.6% |
| Mean | 21.7% | 11.3% |
| Median | 11.9% | 11.1% |
| Interquartile 25% (IQ1) | 7.9% | 8.6% |
| Interquartile 75% (IQ3) | 25.5% | 13.2% |
| Interquartile Range (IQR) | 17.6% | 4.6% |
| Standard Deviation (Sample) | 23.4% | 4.4% |
| Standard Deviation (Population) | 23.2% | 4.4% |
Similar Demographics by Male Poverty
Demographics Similar to Austrians by Male Poverty
In terms of male poverty, the demographic groups most similar to Austrians are Ukrainian (10.1%, a difference of 0.020%), Immigrants from Italy (10.2%, a difference of 0.090%), Immigrants from Europe (10.1%, a difference of 0.11%), Slovak (10.2%, a difference of 0.13%), and Scandinavian (10.1%, a difference of 0.24%).
| Demographics | Rating | Rank | Male Poverty |
| Immigrants | Austria | 98.5 /100 | #54 | Exceptional 10.0% |
| Germans | 98.3 /100 | #55 | Exceptional 10.1% |
| Immigrants | Bulgaria | 98.2 /100 | #56 | Exceptional 10.1% |
| Estonians | 98.1 /100 | #57 | Exceptional 10.1% |
| Scandinavians | 98.0 /100 | #58 | Exceptional 10.1% |
| Immigrants | Europe | 97.9 /100 | #59 | Exceptional 10.1% |
| Ukrainians | 97.9 /100 | #60 | Exceptional 10.1% |
| Austrians | 97.8 /100 | #61 | Exceptional 10.1% |
| Immigrants | Italy | 97.8 /100 | #62 | Exceptional 10.2% |
| Slovaks | 97.7 /100 | #63 | Exceptional 10.2% |
| Swiss | 97.5 /100 | #64 | Exceptional 10.2% |
| Zimbabweans | 97.5 /100 | #65 | Exceptional 10.2% |
| Serbians | 97.5 /100 | #66 | Exceptional 10.2% |
| Immigrants | Netherlands | 97.3 /100 | #67 | Exceptional 10.2% |
| Immigrants | Sri Lanka | 97.2 /100 | #68 | Exceptional 10.2% |
Demographics Similar to Immigrants from Armenia by Male Poverty
In terms of male poverty, the demographic groups most similar to Immigrants from Armenia are Fijian (12.6%, a difference of 0.060%), Nicaraguan (12.6%, a difference of 0.11%), Salvadoran (12.6%, a difference of 0.23%), Immigrants from Laos (12.6%, a difference of 0.36%), and Immigrants from Saudi Arabia (12.7%, a difference of 0.61%).
| Demographics | Rating | Rank | Male Poverty |
| Alaska Natives | 1.4 /100 | #227 | Tragic 12.4% |
| Alsatians | 1.3 /100 | #228 | Tragic 12.4% |
| Cubans | 1.3 /100 | #229 | Tragic 12.4% |
| Marshallese | 0.8 /100 | #230 | Tragic 12.5% |
| Salvadorans | 0.6 /100 | #231 | Tragic 12.6% |
| Nicaraguans | 0.6 /100 | #232 | Tragic 12.6% |
| Fijians | 0.6 /100 | #233 | Tragic 12.6% |
| Immigrants | Armenia | 0.6 /100 | #234 | Tragic 12.6% |
| Immigrants | Laos | 0.5 /100 | #235 | Tragic 12.6% |
| Immigrants | Saudi Arabia | 0.4 /100 | #236 | Tragic 12.7% |
| French American Indians | 0.4 /100 | #237 | Tragic 12.7% |
| Ecuadorians | 0.4 /100 | #238 | Tragic 12.7% |
| Ghanaians | 0.4 /100 | #239 | Tragic 12.7% |
| Immigrants | Middle Africa | 0.4 /100 | #240 | Tragic 12.7% |
| Sudanese | 0.3 /100 | #241 | Tragic 12.8% |