Assyrian/Chaldean/Syriac vs Immigrants from Denmark Receiving Food Stamps
COMPARE
Assyrian/Chaldean/Syriac
Immigrants from Denmark
Receiving Food Stamps
Receiving Food Stamps Comparison
Assyrians/Chaldeans/Syriacs
Immigrants from Denmark
10.6%
RECEIVING FOOD STAMPS
94.1/ 100
METRIC RATING
118th/ 347
METRIC RANK
9.6%
RECEIVING FOOD STAMPS
99.4/ 100
METRIC RATING
44th/ 347
METRIC RANK
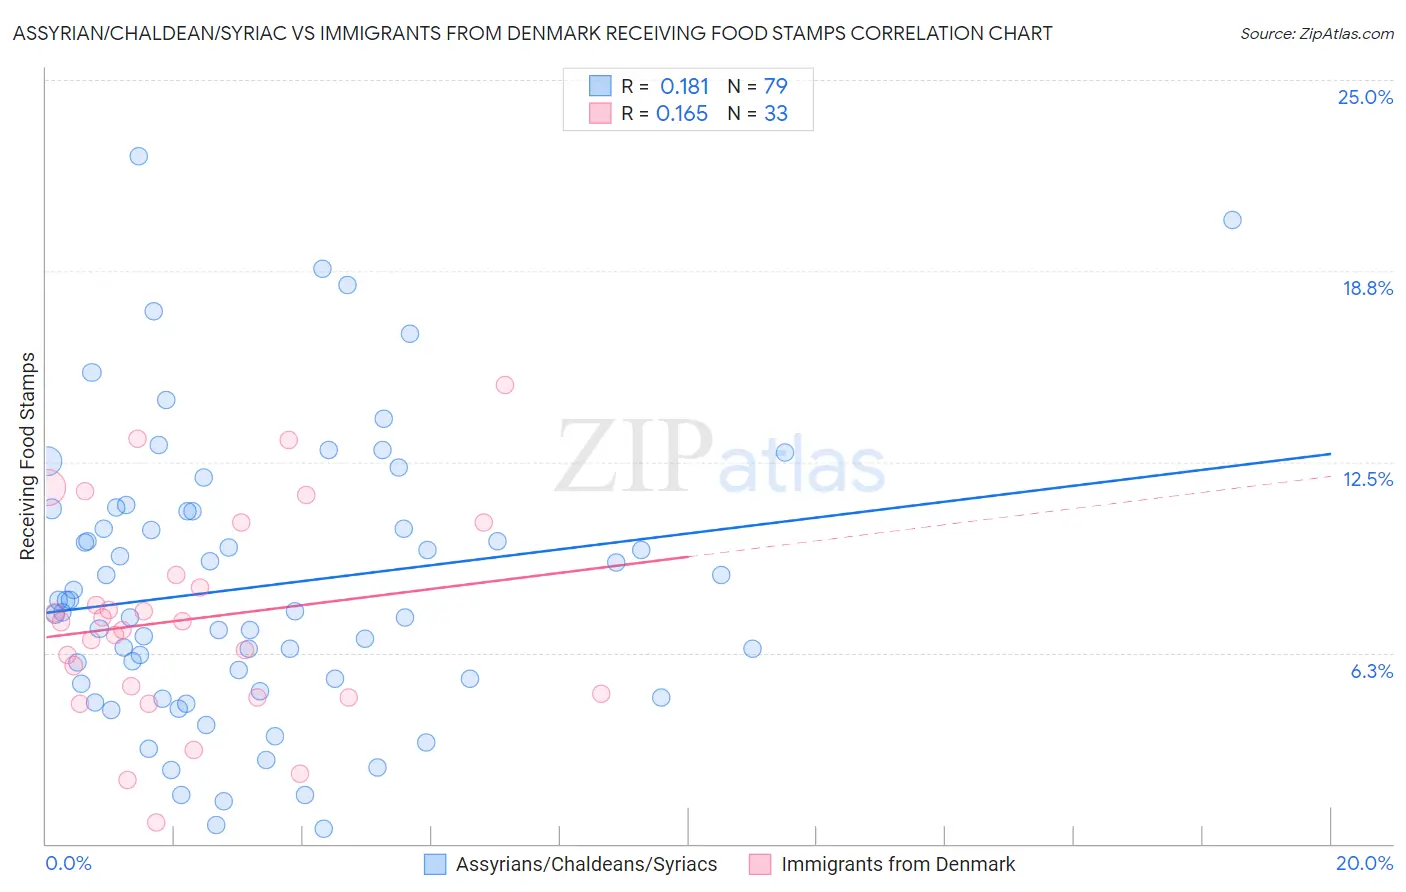
Assyrian/Chaldean/Syriac vs Immigrants from Denmark Receiving Food Stamps Correlation Chart
The statistical analysis conducted on geographies consisting of 110,240,637 people shows a poor positive correlation between the proportion of Assyrians/Chaldeans/Syriacs and percentage of population receiving government assistance and/or food stamps in the United States with a correlation coefficient (R) of 0.181 and weighted average of 10.6%. Similarly, the statistical analysis conducted on geographies consisting of 136,213,097 people shows a poor positive correlation between the proportion of Immigrants from Denmark and percentage of population receiving government assistance and/or food stamps in the United States with a correlation coefficient (R) of 0.165 and weighted average of 9.6%, a difference of 10.2%.
Receiving Food Stamps Correlation Summary
| Measurement | Assyrian/Chaldean/Syriac | Immigrants from Denmark |
| Minimum | 0.50% | 0.68% |
| Maximum | 22.5% | 15.0% |
| Range | 22.0% | 14.3% |
| Mean | 8.4% | 7.4% |
| Median | 7.6% | 7.3% |
| Interquartile 25% (IQ1) | 5.2% | 4.8% |
| Interquartile 75% (IQ3) | 10.9% | 9.7% |
| Interquartile Range (IQR) | 5.7% | 4.8% |
| Standard Deviation (Sample) | 4.6% | 3.4% |
| Standard Deviation (Population) | 4.6% | 3.3% |
Similar Demographics by Receiving Food Stamps
Demographics Similar to Assyrians/Chaldeans/Syriacs by Receiving Food Stamps
In terms of receiving food stamps, the demographic groups most similar to Assyrians/Chaldeans/Syriacs are Immigrants from Poland (10.6%, a difference of 0.16%), Ethiopian (10.6%, a difference of 0.17%), Slavic (10.6%, a difference of 0.20%), Sri Lankan (10.6%, a difference of 0.27%), and Immigrants from Nepal (10.6%, a difference of 0.34%).
| Demographics | Rating | Rank | Receiving Food Stamps |
| Romanians | 95.8 /100 | #111 | Exceptional 10.4% |
| Mongolians | 95.8 /100 | #112 | Exceptional 10.5% |
| Icelanders | 95.4 /100 | #113 | Exceptional 10.5% |
| Scotch-Irish | 95.1 /100 | #114 | Exceptional 10.5% |
| Immigrants | Saudi Arabia | 94.9 /100 | #115 | Exceptional 10.5% |
| Canadians | 94.8 /100 | #116 | Exceptional 10.5% |
| Immigrants | Nepal | 94.6 /100 | #117 | Exceptional 10.6% |
| Assyrians/Chaldeans/Syriacs | 94.1 /100 | #118 | Exceptional 10.6% |
| Immigrants | Poland | 93.9 /100 | #119 | Exceptional 10.6% |
| Ethiopians | 93.9 /100 | #120 | Exceptional 10.6% |
| Slavs | 93.8 /100 | #121 | Exceptional 10.6% |
| Sri Lankans | 93.7 /100 | #122 | Exceptional 10.6% |
| Immigrants | Philippines | 93.3 /100 | #123 | Exceptional 10.7% |
| Paraguayans | 93.0 /100 | #124 | Exceptional 10.7% |
| Ukrainians | 92.8 /100 | #125 | Exceptional 10.7% |
Demographics Similar to Immigrants from Denmark by Receiving Food Stamps
In terms of receiving food stamps, the demographic groups most similar to Immigrants from Denmark are Immigrants from Belgium (9.6%, a difference of 0.030%), Australian (9.6%, a difference of 0.11%), Indian (Asian) (9.6%, a difference of 0.17%), Croatian (9.6%, a difference of 0.23%), and Russian (9.6%, a difference of 0.28%).
| Demographics | Rating | Rank | Receiving Food Stamps |
| Europeans | 99.6 /100 | #37 | Exceptional 9.5% |
| Immigrants | Sri Lanka | 99.5 /100 | #38 | Exceptional 9.5% |
| Immigrants | Bolivia | 99.5 /100 | #39 | Exceptional 9.5% |
| Immigrants | Netherlands | 99.5 /100 | #40 | Exceptional 9.5% |
| Cambodians | 99.5 /100 | #41 | Exceptional 9.5% |
| Immigrants | China | 99.5 /100 | #42 | Exceptional 9.6% |
| Croatians | 99.5 /100 | #43 | Exceptional 9.6% |
| Immigrants | Denmark | 99.4 /100 | #44 | Exceptional 9.6% |
| Immigrants | Belgium | 99.4 /100 | #45 | Exceptional 9.6% |
| Australians | 99.4 /100 | #46 | Exceptional 9.6% |
| Indians (Asian) | 99.4 /100 | #47 | Exceptional 9.6% |
| Russians | 99.4 /100 | #48 | Exceptional 9.6% |
| Immigrants | Czechoslovakia | 99.4 /100 | #49 | Exceptional 9.6% |
| Lithuanians | 99.4 /100 | #50 | Exceptional 9.7% |
| Asians | 99.3 /100 | #51 | Exceptional 9.7% |