Assyrian/Chaldean/Syriac vs Jordanian Receiving Food Stamps
COMPARE
Assyrian/Chaldean/Syriac
Jordanian
Receiving Food Stamps
Receiving Food Stamps Comparison
Assyrians/Chaldeans/Syriacs
Jordanians
10.6%
RECEIVING FOOD STAMPS
94.1/ 100
METRIC RATING
118th/ 347
METRIC RANK
10.2%
RECEIVING FOOD STAMPS
97.9/ 100
METRIC RATING
91st/ 347
METRIC RANK
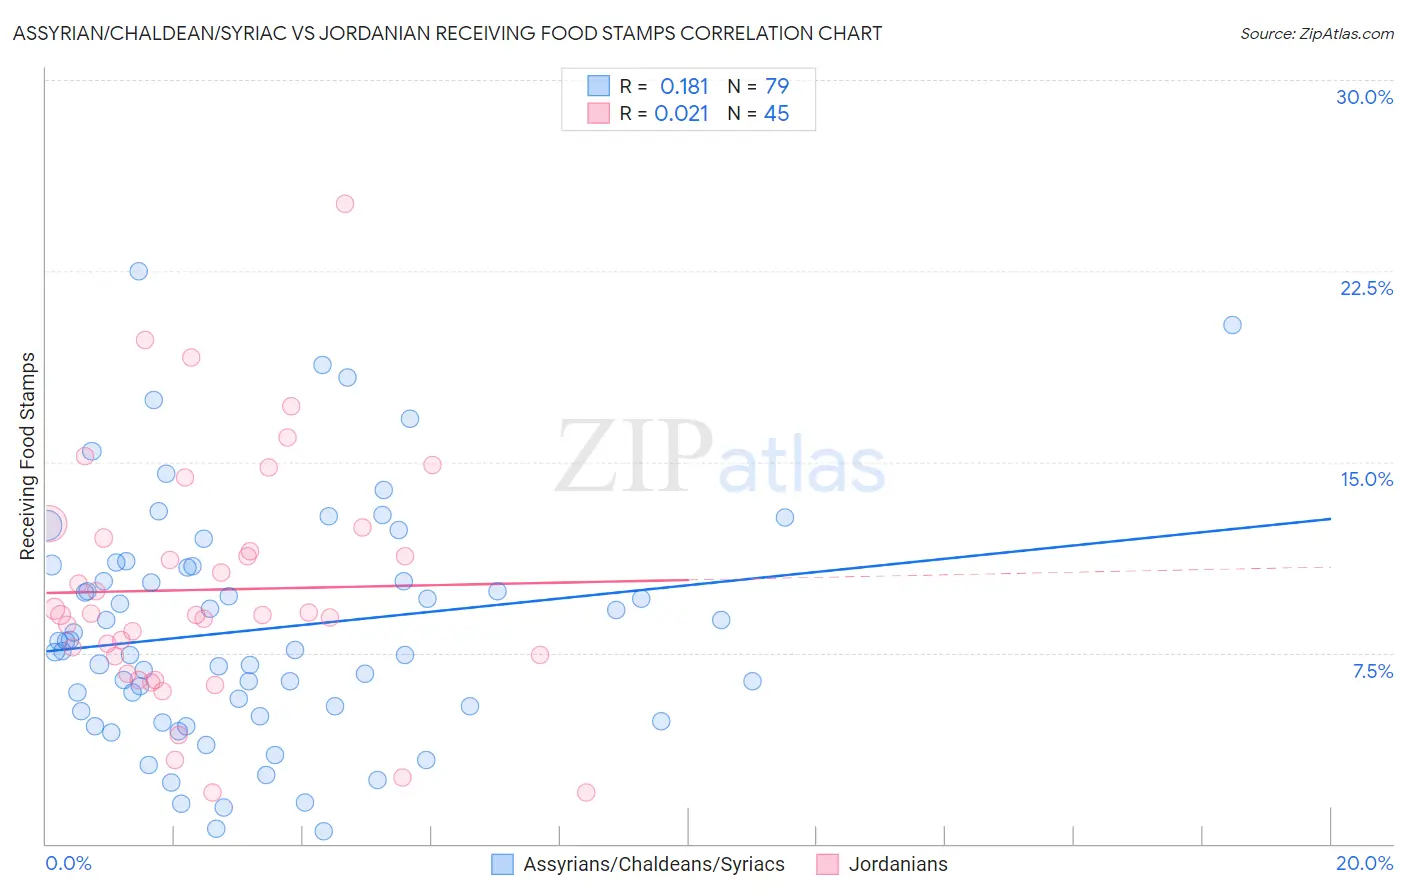
Assyrian/Chaldean/Syriac vs Jordanian Receiving Food Stamps Correlation Chart
The statistical analysis conducted on geographies consisting of 110,240,637 people shows a poor positive correlation between the proportion of Assyrians/Chaldeans/Syriacs and percentage of population receiving government assistance and/or food stamps in the United States with a correlation coefficient (R) of 0.181 and weighted average of 10.6%. Similarly, the statistical analysis conducted on geographies consisting of 166,269,073 people shows no correlation between the proportion of Jordanians and percentage of population receiving government assistance and/or food stamps in the United States with a correlation coefficient (R) of 0.021 and weighted average of 10.2%, a difference of 4.3%.
Receiving Food Stamps Correlation Summary
| Measurement | Assyrian/Chaldean/Syriac | Jordanian |
| Minimum | 0.50% | 2.0% |
| Maximum | 22.5% | 25.2% |
| Range | 22.0% | 23.2% |
| Mean | 8.4% | 10.0% |
| Median | 7.6% | 9.0% |
| Interquartile 25% (IQ1) | 5.2% | 7.0% |
| Interquartile 75% (IQ3) | 10.9% | 12.2% |
| Interquartile Range (IQR) | 5.7% | 5.2% |
| Standard Deviation (Sample) | 4.6% | 4.8% |
| Standard Deviation (Population) | 4.6% | 4.7% |
Similar Demographics by Receiving Food Stamps
Demographics Similar to Assyrians/Chaldeans/Syriacs by Receiving Food Stamps
In terms of receiving food stamps, the demographic groups most similar to Assyrians/Chaldeans/Syriacs are Immigrants from Poland (10.6%, a difference of 0.16%), Ethiopian (10.6%, a difference of 0.17%), Slavic (10.6%, a difference of 0.20%), Sri Lankan (10.6%, a difference of 0.27%), and Immigrants from Nepal (10.6%, a difference of 0.34%).
| Demographics | Rating | Rank | Receiving Food Stamps |
| Romanians | 95.8 /100 | #111 | Exceptional 10.4% |
| Mongolians | 95.8 /100 | #112 | Exceptional 10.5% |
| Icelanders | 95.4 /100 | #113 | Exceptional 10.5% |
| Scotch-Irish | 95.1 /100 | #114 | Exceptional 10.5% |
| Immigrants | Saudi Arabia | 94.9 /100 | #115 | Exceptional 10.5% |
| Canadians | 94.8 /100 | #116 | Exceptional 10.5% |
| Immigrants | Nepal | 94.6 /100 | #117 | Exceptional 10.6% |
| Assyrians/Chaldeans/Syriacs | 94.1 /100 | #118 | Exceptional 10.6% |
| Immigrants | Poland | 93.9 /100 | #119 | Exceptional 10.6% |
| Ethiopians | 93.9 /100 | #120 | Exceptional 10.6% |
| Slavs | 93.8 /100 | #121 | Exceptional 10.6% |
| Sri Lankans | 93.7 /100 | #122 | Exceptional 10.6% |
| Immigrants | Philippines | 93.3 /100 | #123 | Exceptional 10.7% |
| Paraguayans | 93.0 /100 | #124 | Exceptional 10.7% |
| Ukrainians | 92.8 /100 | #125 | Exceptional 10.7% |
Demographics Similar to Jordanians by Receiving Food Stamps
In terms of receiving food stamps, the demographic groups most similar to Jordanians are Irish (10.2%, a difference of 0.0%), Finnish (10.2%, a difference of 0.040%), Belgian (10.2%, a difference of 0.39%), Immigrants from France (10.1%, a difference of 0.89%), and Immigrants from Greece (10.3%, a difference of 0.91%).
| Demographics | Rating | Rank | Receiving Food Stamps |
| Immigrants | Israel | 98.5 /100 | #84 | Exceptional 10.0% |
| Immigrants | Romania | 98.5 /100 | #85 | Exceptional 10.0% |
| Immigrants | Norway | 98.4 /100 | #86 | Exceptional 10.0% |
| Egyptians | 98.4 /100 | #87 | Exceptional 10.0% |
| Immigrants | Kuwait | 98.4 /100 | #88 | Exceptional 10.0% |
| Immigrants | France | 98.3 /100 | #89 | Exceptional 10.1% |
| Finns | 97.9 /100 | #90 | Exceptional 10.2% |
| Jordanians | 97.9 /100 | #91 | Exceptional 10.2% |
| Irish | 97.9 /100 | #92 | Exceptional 10.2% |
| Belgians | 97.7 /100 | #93 | Exceptional 10.2% |
| Immigrants | Greece | 97.4 /100 | #94 | Exceptional 10.3% |
| Basques | 97.4 /100 | #95 | Exceptional 10.3% |
| Welsh | 97.3 /100 | #96 | Exceptional 10.3% |
| Czechoslovakians | 97.2 /100 | #97 | Exceptional 10.3% |
| Immigrants | Egypt | 97.1 /100 | #98 | Exceptional 10.3% |