Yaqui vs Immigrants from Denmark Receiving Food Stamps
COMPARE
Yaqui
Immigrants from Denmark
Receiving Food Stamps
Receiving Food Stamps Comparison
Yaqui
Immigrants from Denmark
13.9%
RECEIVING FOOD STAMPS
0.5/ 100
METRIC RATING
251st/ 347
METRIC RANK
9.6%
RECEIVING FOOD STAMPS
99.4/ 100
METRIC RATING
44th/ 347
METRIC RANK
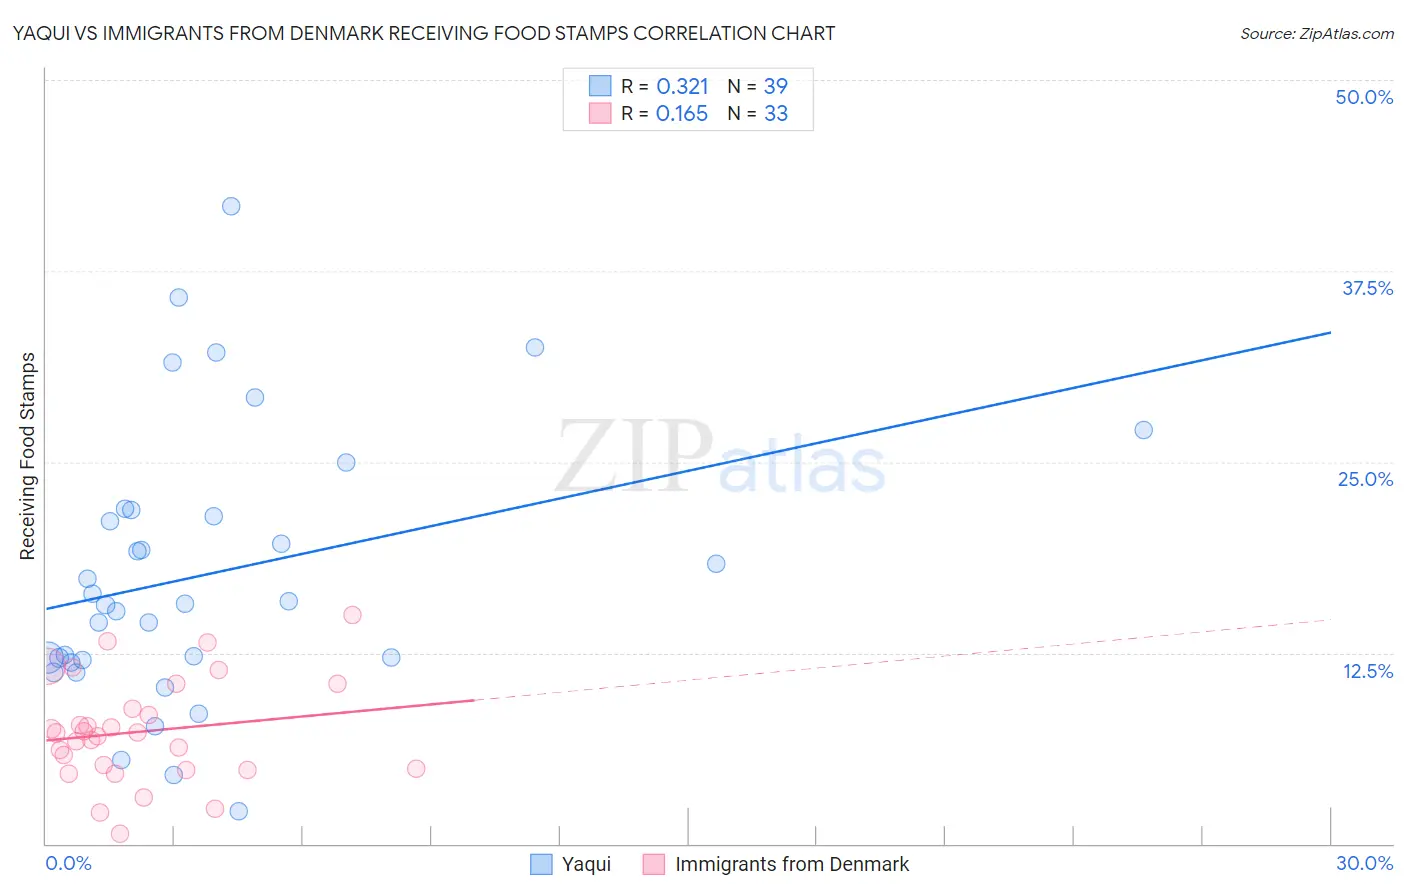
Yaqui vs Immigrants from Denmark Receiving Food Stamps Correlation Chart
The statistical analysis conducted on geographies consisting of 107,632,766 people shows a mild positive correlation between the proportion of Yaqui and percentage of population receiving government assistance and/or food stamps in the United States with a correlation coefficient (R) of 0.321 and weighted average of 13.9%. Similarly, the statistical analysis conducted on geographies consisting of 136,213,097 people shows a poor positive correlation between the proportion of Immigrants from Denmark and percentage of population receiving government assistance and/or food stamps in the United States with a correlation coefficient (R) of 0.165 and weighted average of 9.6%, a difference of 44.5%.
Receiving Food Stamps Correlation Summary
| Measurement | Yaqui | Immigrants from Denmark |
| Minimum | 2.1% | 0.68% |
| Maximum | 41.8% | 15.0% |
| Range | 39.7% | 14.3% |
| Mean | 17.7% | 7.4% |
| Median | 15.7% | 7.3% |
| Interquartile 25% (IQ1) | 12.0% | 4.8% |
| Interquartile 75% (IQ3) | 21.8% | 9.7% |
| Interquartile Range (IQR) | 9.8% | 4.8% |
| Standard Deviation (Sample) | 8.9% | 3.4% |
| Standard Deviation (Population) | 8.8% | 3.3% |
Similar Demographics by Receiving Food Stamps
Demographics Similar to Yaqui by Receiving Food Stamps
In terms of receiving food stamps, the demographic groups most similar to Yaqui are Immigrants from Cambodia (13.9%, a difference of 0.070%), Indonesian (13.9%, a difference of 0.24%), Ghanaian (14.0%, a difference of 0.44%), Spanish American (14.0%, a difference of 0.82%), and Immigrants from Laos (13.8%, a difference of 0.88%).
| Demographics | Rating | Rank | Receiving Food Stamps |
| Cajuns | 0.9 /100 | #244 | Tragic 13.7% |
| Immigrants | Somalia | 0.9 /100 | #245 | Tragic 13.7% |
| Cree | 0.8 /100 | #246 | Tragic 13.7% |
| Mexican American Indians | 0.7 /100 | #247 | Tragic 13.8% |
| Immigrants | Laos | 0.7 /100 | #248 | Tragic 13.8% |
| Indonesians | 0.6 /100 | #249 | Tragic 13.9% |
| Immigrants | Cambodia | 0.5 /100 | #250 | Tragic 13.9% |
| Yaqui | 0.5 /100 | #251 | Tragic 13.9% |
| Ghanaians | 0.5 /100 | #252 | Tragic 14.0% |
| Spanish Americans | 0.4 /100 | #253 | Tragic 14.0% |
| Marshallese | 0.3 /100 | #254 | Tragic 14.1% |
| Sub-Saharan Africans | 0.3 /100 | #255 | Tragic 14.1% |
| Japanese | 0.3 /100 | #256 | Tragic 14.1% |
| Arapaho | 0.3 /100 | #257 | Tragic 14.1% |
| Immigrants | Ghana | 0.3 /100 | #258 | Tragic 14.1% |
Demographics Similar to Immigrants from Denmark by Receiving Food Stamps
In terms of receiving food stamps, the demographic groups most similar to Immigrants from Denmark are Immigrants from Belgium (9.6%, a difference of 0.030%), Australian (9.6%, a difference of 0.11%), Indian (Asian) (9.6%, a difference of 0.17%), Croatian (9.6%, a difference of 0.23%), and Russian (9.6%, a difference of 0.28%).
| Demographics | Rating | Rank | Receiving Food Stamps |
| Europeans | 99.6 /100 | #37 | Exceptional 9.5% |
| Immigrants | Sri Lanka | 99.5 /100 | #38 | Exceptional 9.5% |
| Immigrants | Bolivia | 99.5 /100 | #39 | Exceptional 9.5% |
| Immigrants | Netherlands | 99.5 /100 | #40 | Exceptional 9.5% |
| Cambodians | 99.5 /100 | #41 | Exceptional 9.5% |
| Immigrants | China | 99.5 /100 | #42 | Exceptional 9.6% |
| Croatians | 99.5 /100 | #43 | Exceptional 9.6% |
| Immigrants | Denmark | 99.4 /100 | #44 | Exceptional 9.6% |
| Immigrants | Belgium | 99.4 /100 | #45 | Exceptional 9.6% |
| Australians | 99.4 /100 | #46 | Exceptional 9.6% |
| Indians (Asian) | 99.4 /100 | #47 | Exceptional 9.6% |
| Russians | 99.4 /100 | #48 | Exceptional 9.6% |
| Immigrants | Czechoslovakia | 99.4 /100 | #49 | Exceptional 9.6% |
| Lithuanians | 99.4 /100 | #50 | Exceptional 9.7% |
| Asians | 99.3 /100 | #51 | Exceptional 9.7% |