Assyrian/Chaldean/Syriac vs Immigrants from Denmark Disability Age Over 75
COMPARE
Assyrian/Chaldean/Syriac
Immigrants from Denmark
Disability Age Over 75
Disability Age Over 75 Comparison
Assyrians/Chaldeans/Syriacs
Immigrants from Denmark
49.1%
DISABILITY AGE OVER 75
0.2/ 100
METRIC RATING
272nd/ 347
METRIC RANK
45.4%
DISABILITY AGE OVER 75
99.9/ 100
METRIC RATING
30th/ 347
METRIC RANK
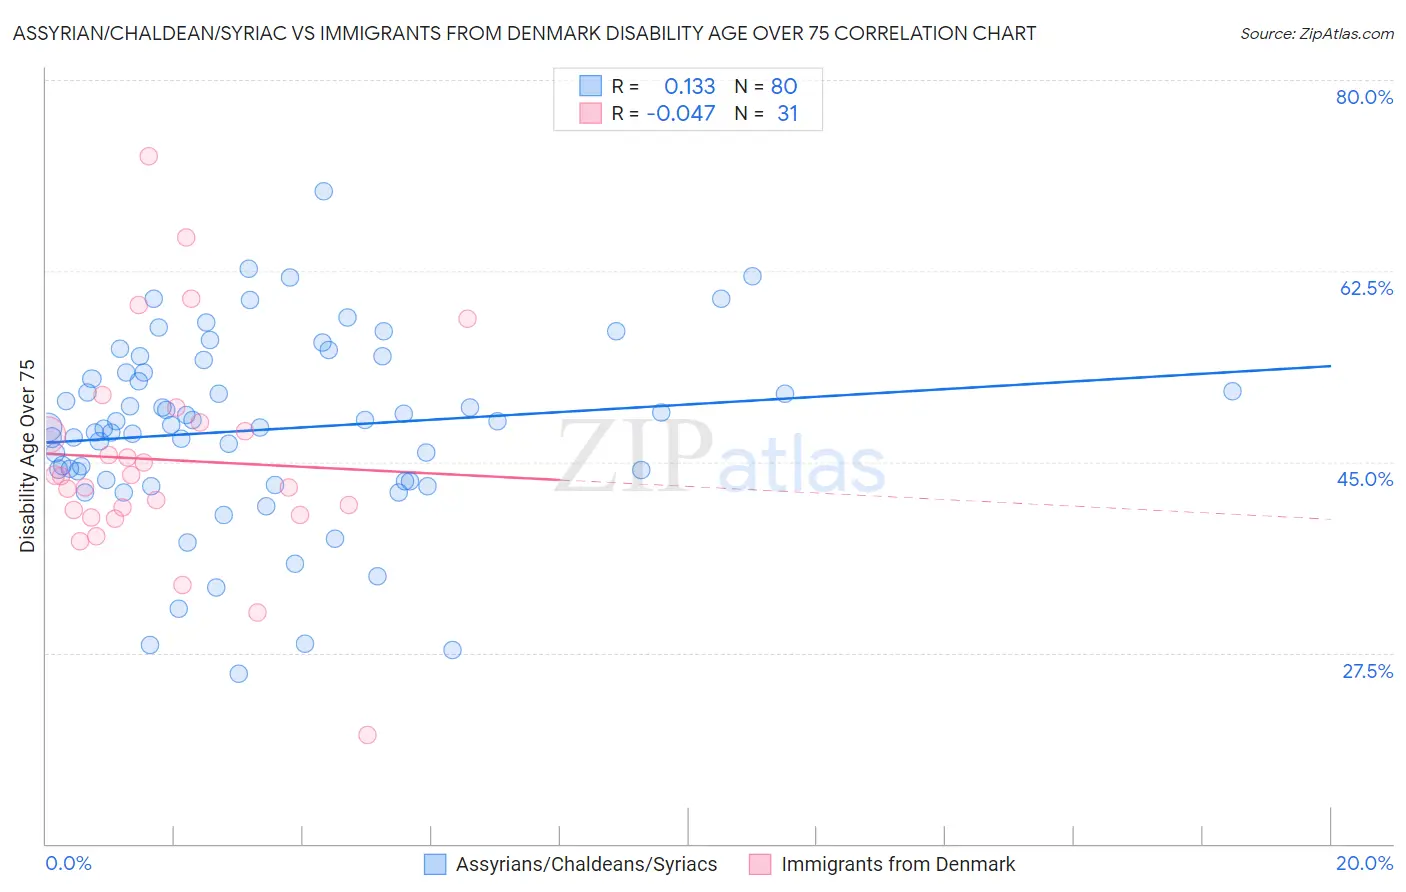
Assyrian/Chaldean/Syriac vs Immigrants from Denmark Disability Age Over 75 Correlation Chart
The statistical analysis conducted on geographies consisting of 110,272,420 people shows a poor positive correlation between the proportion of Assyrians/Chaldeans/Syriacs and percentage of population with a disability over the age of 75 in the United States with a correlation coefficient (R) of 0.133 and weighted average of 49.1%. Similarly, the statistical analysis conducted on geographies consisting of 136,379,730 people shows no correlation between the proportion of Immigrants from Denmark and percentage of population with a disability over the age of 75 in the United States with a correlation coefficient (R) of -0.047 and weighted average of 45.4%, a difference of 8.0%.
Disability Age Over 75 Correlation Summary
| Measurement | Assyrian/Chaldean/Syriac | Immigrants from Denmark |
| Minimum | 25.6% | 20.0% |
| Maximum | 69.9% | 73.0% |
| Range | 44.3% | 53.0% |
| Mean | 47.9% | 45.2% |
| Median | 48.2% | 43.7% |
| Interquartile 25% (IQ1) | 43.3% | 40.2% |
| Interquartile 75% (IQ3) | 53.1% | 48.6% |
| Interquartile Range (IQR) | 9.9% | 8.4% |
| Standard Deviation (Sample) | 8.5% | 10.2% |
| Standard Deviation (Population) | 8.4% | 10.0% |
Similar Demographics by Disability Age Over 75
Demographics Similar to Assyrians/Chaldeans/Syriacs by Disability Age Over 75
In terms of disability age over 75, the demographic groups most similar to Assyrians/Chaldeans/Syriacs are Fijian (49.0%, a difference of 0.010%), Potawatomi (49.0%, a difference of 0.030%), Immigrants from Iraq (49.1%, a difference of 0.050%), Immigrants from El Salvador (49.0%, a difference of 0.060%), and Guatemalan (49.0%, a difference of 0.080%).
| Demographics | Rating | Rank | Disability Age Over 75 |
| Hondurans | 0.3 /100 | #265 | Tragic 48.9% |
| U.S. Virgin Islanders | 0.2 /100 | #266 | Tragic 48.9% |
| Malaysians | 0.2 /100 | #267 | Tragic 49.0% |
| Guatemalans | 0.2 /100 | #268 | Tragic 49.0% |
| Immigrants | El Salvador | 0.2 /100 | #269 | Tragic 49.0% |
| Potawatomi | 0.2 /100 | #270 | Tragic 49.0% |
| Fijians | 0.2 /100 | #271 | Tragic 49.0% |
| Assyrians/Chaldeans/Syriacs | 0.2 /100 | #272 | Tragic 49.1% |
| Immigrants | Iraq | 0.1 /100 | #273 | Tragic 49.1% |
| Immigrants | Guatemala | 0.1 /100 | #274 | Tragic 49.1% |
| Immigrants | Dominica | 0.1 /100 | #275 | Tragic 49.1% |
| Immigrants | Uzbekistan | 0.1 /100 | #276 | Tragic 49.2% |
| Hawaiians | 0.1 /100 | #277 | Tragic 49.2% |
| Immigrants | Laos | 0.1 /100 | #278 | Tragic 49.2% |
| Guamanians/Chamorros | 0.0 /100 | #279 | Tragic 49.4% |
Demographics Similar to Immigrants from Denmark by Disability Age Over 75
In terms of disability age over 75, the demographic groups most similar to Immigrants from Denmark are Filipino (45.4%, a difference of 0.030%), Thai (45.4%, a difference of 0.070%), Immigrants from Bulgaria (45.5%, a difference of 0.070%), Immigrants from Poland (45.4%, a difference of 0.090%), and Macedonian (45.4%, a difference of 0.10%).
| Demographics | Rating | Rank | Disability Age Over 75 |
| Immigrants | Switzerland | 99.9 /100 | #23 | Exceptional 45.3% |
| Poles | 99.9 /100 | #24 | Exceptional 45.3% |
| Immigrants | Bolivia | 99.9 /100 | #25 | Exceptional 45.4% |
| Macedonians | 99.9 /100 | #26 | Exceptional 45.4% |
| Immigrants | Poland | 99.9 /100 | #27 | Exceptional 45.4% |
| Thais | 99.9 /100 | #28 | Exceptional 45.4% |
| Filipinos | 99.9 /100 | #29 | Exceptional 45.4% |
| Immigrants | Denmark | 99.9 /100 | #30 | Exceptional 45.4% |
| Immigrants | Bulgaria | 99.9 /100 | #31 | Exceptional 45.5% |
| Immigrants | Australia | 99.9 /100 | #32 | Exceptional 45.5% |
| Immigrants | Croatia | 99.9 /100 | #33 | Exceptional 45.5% |
| Russians | 99.9 /100 | #34 | Exceptional 45.5% |
| Norwegians | 99.9 /100 | #35 | Exceptional 45.5% |
| Immigrants | Taiwan | 99.9 /100 | #36 | Exceptional 45.5% |
| South Africans | 99.9 /100 | #37 | Exceptional 45.5% |