Immigrants from Ireland vs Immigrants from Denmark Receiving Food Stamps
COMPARE
Immigrants from Ireland
Immigrants from Denmark
Receiving Food Stamps
Receiving Food Stamps Comparison
Immigrants from Ireland
Immigrants from Denmark
9.2%
RECEIVING FOOD STAMPS
99.8/ 100
METRIC RATING
25th/ 347
METRIC RANK
9.6%
RECEIVING FOOD STAMPS
99.4/ 100
METRIC RATING
44th/ 347
METRIC RANK
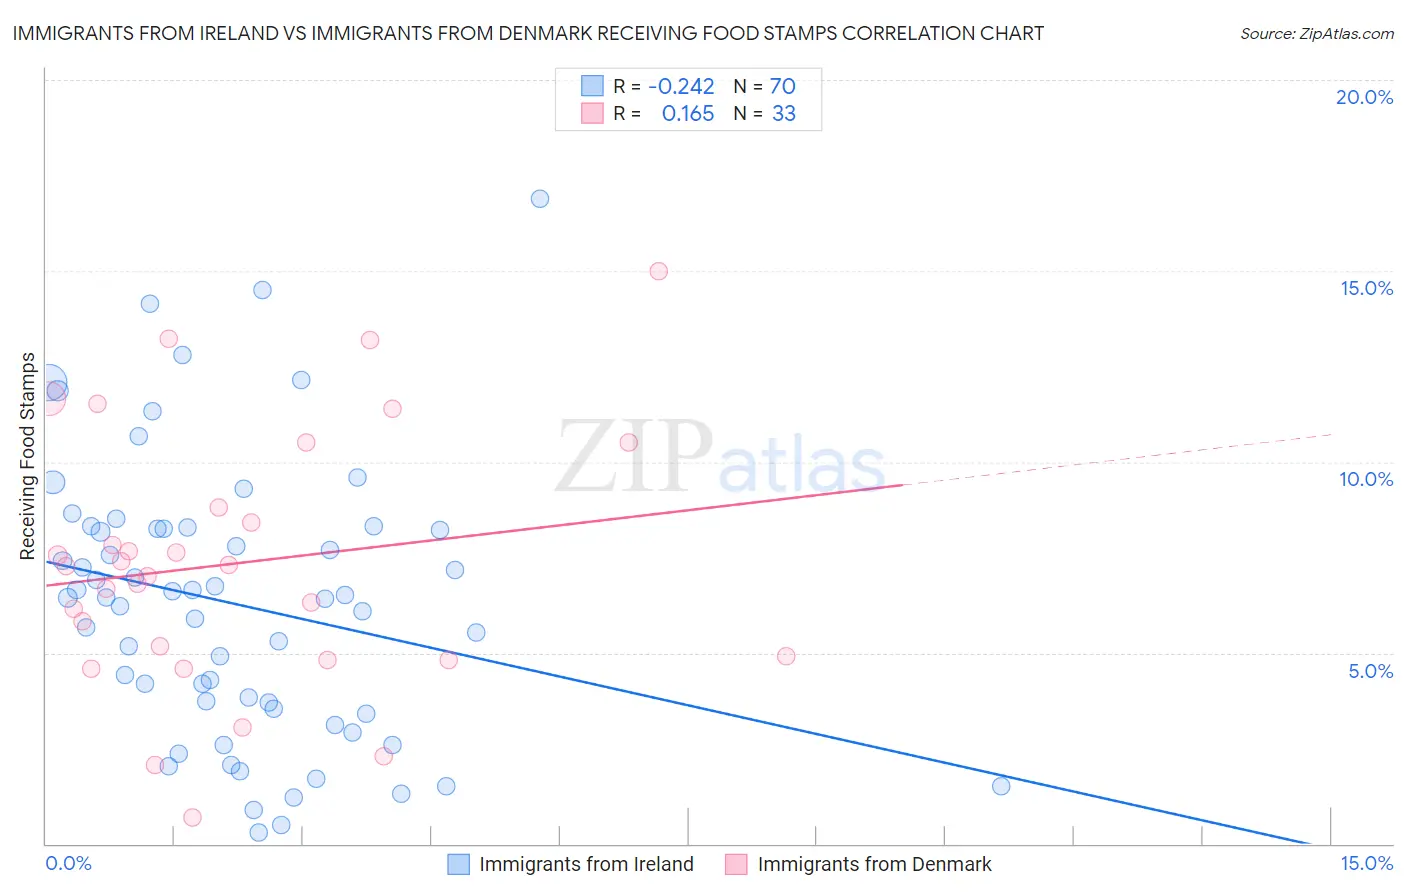
Immigrants from Ireland vs Immigrants from Denmark Receiving Food Stamps Correlation Chart
The statistical analysis conducted on geographies consisting of 240,220,099 people shows a weak negative correlation between the proportion of Immigrants from Ireland and percentage of population receiving government assistance and/or food stamps in the United States with a correlation coefficient (R) of -0.242 and weighted average of 9.2%. Similarly, the statistical analysis conducted on geographies consisting of 136,213,097 people shows a poor positive correlation between the proportion of Immigrants from Denmark and percentage of population receiving government assistance and/or food stamps in the United States with a correlation coefficient (R) of 0.165 and weighted average of 9.6%, a difference of 4.7%.
Receiving Food Stamps Correlation Summary
| Measurement | Immigrants from Ireland | Immigrants from Denmark |
| Minimum | 0.30% | 0.68% |
| Maximum | 16.9% | 15.0% |
| Range | 16.6% | 14.3% |
| Mean | 6.3% | 7.4% |
| Median | 6.5% | 7.3% |
| Interquartile 25% (IQ1) | 3.5% | 4.8% |
| Interquartile 75% (IQ3) | 8.3% | 9.7% |
| Interquartile Range (IQR) | 4.7% | 4.8% |
| Standard Deviation (Sample) | 3.6% | 3.4% |
| Standard Deviation (Population) | 3.6% | 3.3% |
Demographics Similar to Immigrants from Ireland and Immigrants from Denmark by Receiving Food Stamps
In terms of receiving food stamps, the demographic groups most similar to Immigrants from Ireland are Immigrants from Northern Europe (9.2%, a difference of 0.10%), Swedish (9.2%, a difference of 0.20%), Bhutanese (9.2%, a difference of 0.43%), Czech (9.2%, a difference of 0.45%), and Immigrants from Lithuania (9.2%, a difference of 0.72%). Similarly, the demographic groups most similar to Immigrants from Denmark are Croatian (9.6%, a difference of 0.23%), Immigrants from China (9.6%, a difference of 0.53%), Cambodian (9.5%, a difference of 0.78%), Immigrants from Bolivia (9.5%, a difference of 0.96%), and Immigrants from Netherlands (9.5%, a difference of 0.96%).
| Demographics | Rating | Rank | Receiving Food Stamps |
| Immigrants | Northern Europe | 99.8 /100 | #24 | Exceptional 9.2% |
| Immigrants | Ireland | 99.8 /100 | #25 | Exceptional 9.2% |
| Swedes | 99.8 /100 | #26 | Exceptional 9.2% |
| Bhutanese | 99.8 /100 | #27 | Exceptional 9.2% |
| Czechs | 99.8 /100 | #28 | Exceptional 9.2% |
| Immigrants | Lithuania | 99.8 /100 | #29 | Exceptional 9.2% |
| Immigrants | Sweden | 99.7 /100 | #30 | Exceptional 9.3% |
| Immigrants | Eastern Asia | 99.7 /100 | #31 | Exceptional 9.3% |
| Bolivians | 99.7 /100 | #32 | Exceptional 9.3% |
| Zimbabweans | 99.6 /100 | #33 | Exceptional 9.5% |
| Turks | 99.6 /100 | #34 | Exceptional 9.5% |
| Immigrants | Austria | 99.6 /100 | #35 | Exceptional 9.5% |
| Estonians | 99.6 /100 | #36 | Exceptional 9.5% |
| Europeans | 99.6 /100 | #37 | Exceptional 9.5% |
| Immigrants | Sri Lanka | 99.5 /100 | #38 | Exceptional 9.5% |
| Immigrants | Bolivia | 99.5 /100 | #39 | Exceptional 9.5% |
| Immigrants | Netherlands | 99.5 /100 | #40 | Exceptional 9.5% |
| Cambodians | 99.5 /100 | #41 | Exceptional 9.5% |
| Immigrants | China | 99.5 /100 | #42 | Exceptional 9.6% |
| Croatians | 99.5 /100 | #43 | Exceptional 9.6% |
| Immigrants | Denmark | 99.4 /100 | #44 | Exceptional 9.6% |