Cuban vs Immigrants from Denmark Receiving Food Stamps
COMPARE
Cuban
Immigrants from Denmark
Receiving Food Stamps
Receiving Food Stamps Comparison
Cubans
Immigrants from Denmark
18.2%
RECEIVING FOOD STAMPS
0.0/ 100
METRIC RATING
326th/ 347
METRIC RANK
9.6%
RECEIVING FOOD STAMPS
99.4/ 100
METRIC RATING
44th/ 347
METRIC RANK
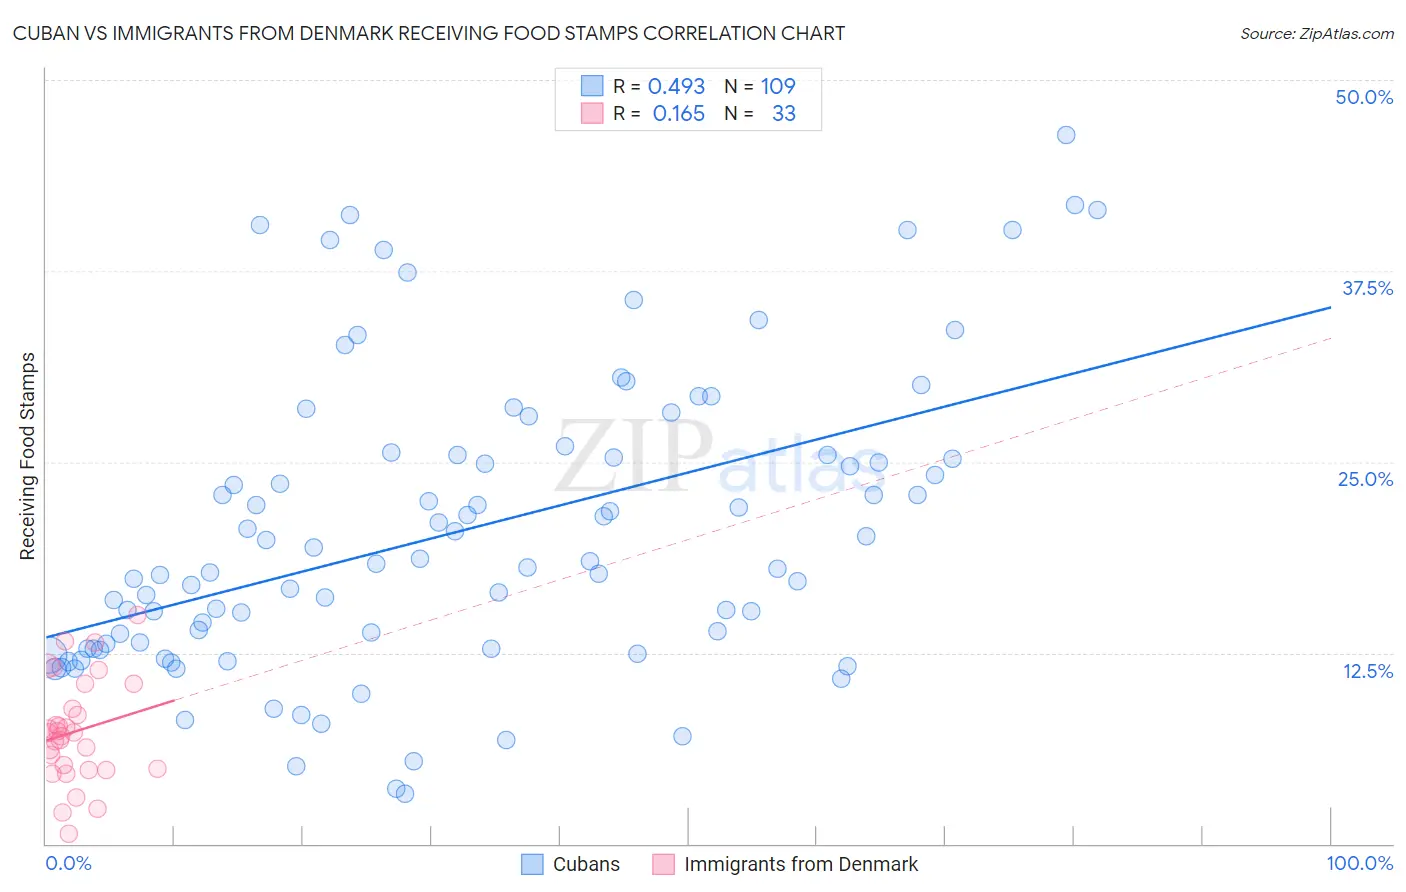
Cuban vs Immigrants from Denmark Receiving Food Stamps Correlation Chart
The statistical analysis conducted on geographies consisting of 447,765,470 people shows a moderate positive correlation between the proportion of Cubans and percentage of population receiving government assistance and/or food stamps in the United States with a correlation coefficient (R) of 0.493 and weighted average of 18.2%. Similarly, the statistical analysis conducted on geographies consisting of 136,213,097 people shows a poor positive correlation between the proportion of Immigrants from Denmark and percentage of population receiving government assistance and/or food stamps in the United States with a correlation coefficient (R) of 0.165 and weighted average of 9.6%, a difference of 89.6%.
Receiving Food Stamps Correlation Summary
| Measurement | Cuban | Immigrants from Denmark |
| Minimum | 3.3% | 0.68% |
| Maximum | 46.4% | 15.0% |
| Range | 43.1% | 14.3% |
| Mean | 20.4% | 7.4% |
| Median | 18.3% | 7.3% |
| Interquartile 25% (IQ1) | 12.8% | 4.8% |
| Interquartile 75% (IQ3) | 25.5% | 9.7% |
| Interquartile Range (IQR) | 12.7% | 4.8% |
| Standard Deviation (Sample) | 9.6% | 3.4% |
| Standard Deviation (Population) | 9.6% | 3.3% |
Similar Demographics by Receiving Food Stamps
Demographics Similar to Cubans by Receiving Food Stamps
In terms of receiving food stamps, the demographic groups most similar to Cubans are Immigrants from Haiti (18.2%, a difference of 0.11%), Apache (18.3%, a difference of 0.31%), Colville (18.3%, a difference of 0.52%), Immigrants from Dominica (18.4%, a difference of 0.98%), and British West Indian (17.9%, a difference of 1.9%).
| Demographics | Rating | Rank | Receiving Food Stamps |
| Immigrants | St. Vincent and the Grenadines | 0.0 /100 | #319 | Tragic 17.2% |
| Immigrants | Nicaragua | 0.0 /100 | #320 | Tragic 17.2% |
| Natives/Alaskans | 0.0 /100 | #321 | Tragic 17.3% |
| Immigrants | Grenada | 0.0 /100 | #322 | Tragic 17.8% |
| Haitians | 0.0 /100 | #323 | Tragic 17.8% |
| British West Indians | 0.0 /100 | #324 | Tragic 17.9% |
| Immigrants | Haiti | 0.0 /100 | #325 | Tragic 18.2% |
| Cubans | 0.0 /100 | #326 | Tragic 18.2% |
| Apache | 0.0 /100 | #327 | Tragic 18.3% |
| Colville | 0.0 /100 | #328 | Tragic 18.3% |
| Immigrants | Dominica | 0.0 /100 | #329 | Tragic 18.4% |
| Pima | 0.0 /100 | #330 | Tragic 19.0% |
| Immigrants | Caribbean | 0.0 /100 | #331 | Tragic 19.6% |
| Pueblo | 0.0 /100 | #332 | Tragic 19.9% |
| Inupiat | 0.0 /100 | #333 | Tragic 20.1% |
Demographics Similar to Immigrants from Denmark by Receiving Food Stamps
In terms of receiving food stamps, the demographic groups most similar to Immigrants from Denmark are Immigrants from Belgium (9.6%, a difference of 0.030%), Australian (9.6%, a difference of 0.11%), Indian (Asian) (9.6%, a difference of 0.17%), Croatian (9.6%, a difference of 0.23%), and Russian (9.6%, a difference of 0.28%).
| Demographics | Rating | Rank | Receiving Food Stamps |
| Europeans | 99.6 /100 | #37 | Exceptional 9.5% |
| Immigrants | Sri Lanka | 99.5 /100 | #38 | Exceptional 9.5% |
| Immigrants | Bolivia | 99.5 /100 | #39 | Exceptional 9.5% |
| Immigrants | Netherlands | 99.5 /100 | #40 | Exceptional 9.5% |
| Cambodians | 99.5 /100 | #41 | Exceptional 9.5% |
| Immigrants | China | 99.5 /100 | #42 | Exceptional 9.6% |
| Croatians | 99.5 /100 | #43 | Exceptional 9.6% |
| Immigrants | Denmark | 99.4 /100 | #44 | Exceptional 9.6% |
| Immigrants | Belgium | 99.4 /100 | #45 | Exceptional 9.6% |
| Australians | 99.4 /100 | #46 | Exceptional 9.6% |
| Indians (Asian) | 99.4 /100 | #47 | Exceptional 9.6% |
| Russians | 99.4 /100 | #48 | Exceptional 9.6% |
| Immigrants | Czechoslovakia | 99.4 /100 | #49 | Exceptional 9.6% |
| Lithuanians | 99.4 /100 | #50 | Exceptional 9.7% |
| Asians | 99.3 /100 | #51 | Exceptional 9.7% |