Iraqi vs Immigrants from Denmark Receiving Food Stamps
COMPARE
Iraqi
Immigrants from Denmark
Receiving Food Stamps
Receiving Food Stamps Comparison
Iraqis
Immigrants from Denmark
12.2%
RECEIVING FOOD STAMPS
26.6/ 100
METRIC RATING
196th/ 347
METRIC RANK
9.6%
RECEIVING FOOD STAMPS
99.4/ 100
METRIC RATING
44th/ 347
METRIC RANK
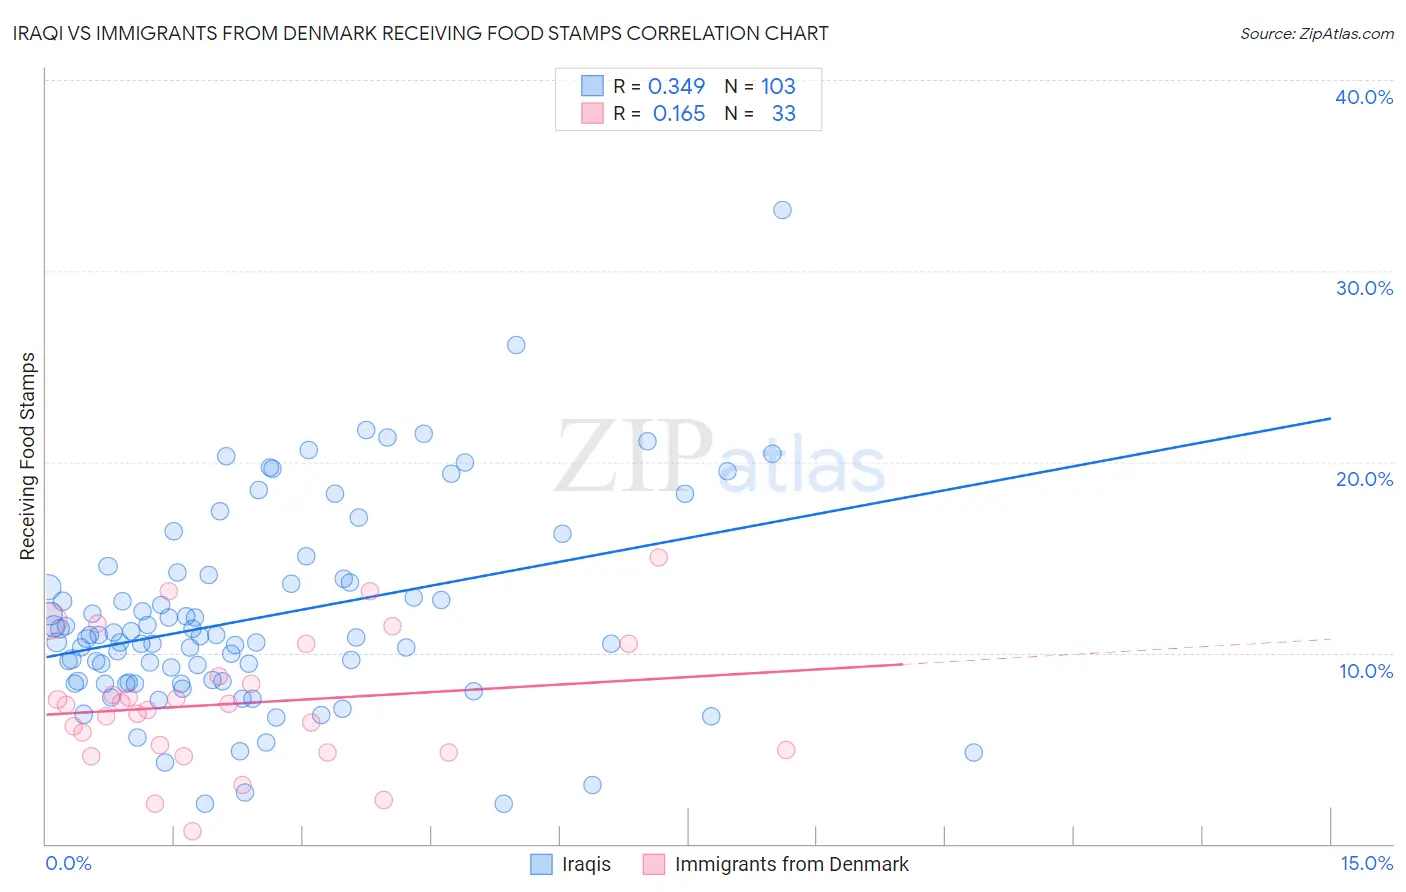
Iraqi vs Immigrants from Denmark Receiving Food Stamps Correlation Chart
The statistical analysis conducted on geographies consisting of 170,465,445 people shows a mild positive correlation between the proportion of Iraqis and percentage of population receiving government assistance and/or food stamps in the United States with a correlation coefficient (R) of 0.349 and weighted average of 12.2%. Similarly, the statistical analysis conducted on geographies consisting of 136,213,097 people shows a poor positive correlation between the proportion of Immigrants from Denmark and percentage of population receiving government assistance and/or food stamps in the United States with a correlation coefficient (R) of 0.165 and weighted average of 9.6%, a difference of 26.5%.
Receiving Food Stamps Correlation Summary
| Measurement | Iraqi | Immigrants from Denmark |
| Minimum | 2.1% | 0.68% |
| Maximum | 33.2% | 15.0% |
| Range | 31.1% | 14.3% |
| Mean | 11.8% | 7.4% |
| Median | 10.8% | 7.3% |
| Interquartile 25% (IQ1) | 8.4% | 4.8% |
| Interquartile 75% (IQ3) | 13.9% | 9.7% |
| Interquartile Range (IQR) | 5.5% | 4.8% |
| Standard Deviation (Sample) | 5.3% | 3.4% |
| Standard Deviation (Population) | 5.2% | 3.3% |
Similar Demographics by Receiving Food Stamps
Demographics Similar to Iraqis by Receiving Food Stamps
In terms of receiving food stamps, the demographic groups most similar to Iraqis are American (12.2%, a difference of 0.030%), Delaware (12.2%, a difference of 0.080%), Immigrants from Sudan (12.1%, a difference of 0.090%), Immigrants from Fiji (12.1%, a difference of 0.21%), and Immigrants from Costa Rica (12.2%, a difference of 0.21%).
| Demographics | Rating | Rank | Receiving Food Stamps |
| Immigrants | Cameroon | 32.5 /100 | #189 | Fair 12.0% |
| Immigrants | Peru | 32.2 /100 | #190 | Fair 12.0% |
| Venezuelans | 32.1 /100 | #191 | Fair 12.0% |
| Samoans | 31.0 /100 | #192 | Fair 12.1% |
| Immigrants | Fiji | 27.8 /100 | #193 | Fair 12.1% |
| Immigrants | Sudan | 27.1 /100 | #194 | Fair 12.1% |
| Americans | 26.7 /100 | #195 | Fair 12.2% |
| Iraqis | 26.6 /100 | #196 | Fair 12.2% |
| Delaware | 26.1 /100 | #197 | Fair 12.2% |
| Immigrants | Costa Rica | 25.4 /100 | #198 | Fair 12.2% |
| Portuguese | 25.1 /100 | #199 | Fair 12.2% |
| Sierra Leoneans | 23.6 /100 | #200 | Fair 12.2% |
| Ugandans | 22.5 /100 | #201 | Fair 12.2% |
| Immigrants | Venezuela | 20.1 /100 | #202 | Fair 12.3% |
| Shoshone | 17.7 /100 | #203 | Poor 12.4% |
Demographics Similar to Immigrants from Denmark by Receiving Food Stamps
In terms of receiving food stamps, the demographic groups most similar to Immigrants from Denmark are Immigrants from Belgium (9.6%, a difference of 0.030%), Australian (9.6%, a difference of 0.11%), Indian (Asian) (9.6%, a difference of 0.17%), Croatian (9.6%, a difference of 0.23%), and Russian (9.6%, a difference of 0.28%).
| Demographics | Rating | Rank | Receiving Food Stamps |
| Europeans | 99.6 /100 | #37 | Exceptional 9.5% |
| Immigrants | Sri Lanka | 99.5 /100 | #38 | Exceptional 9.5% |
| Immigrants | Bolivia | 99.5 /100 | #39 | Exceptional 9.5% |
| Immigrants | Netherlands | 99.5 /100 | #40 | Exceptional 9.5% |
| Cambodians | 99.5 /100 | #41 | Exceptional 9.5% |
| Immigrants | China | 99.5 /100 | #42 | Exceptional 9.6% |
| Croatians | 99.5 /100 | #43 | Exceptional 9.6% |
| Immigrants | Denmark | 99.4 /100 | #44 | Exceptional 9.6% |
| Immigrants | Belgium | 99.4 /100 | #45 | Exceptional 9.6% |
| Australians | 99.4 /100 | #46 | Exceptional 9.6% |
| Indians (Asian) | 99.4 /100 | #47 | Exceptional 9.6% |
| Russians | 99.4 /100 | #48 | Exceptional 9.6% |
| Immigrants | Czechoslovakia | 99.4 /100 | #49 | Exceptional 9.6% |
| Lithuanians | 99.4 /100 | #50 | Exceptional 9.7% |
| Asians | 99.3 /100 | #51 | Exceptional 9.7% |