Assyrian/Chaldean/Syriac vs Immigrants from Cambodia Receiving Food Stamps
COMPARE
Assyrian/Chaldean/Syriac
Immigrants from Cambodia
Receiving Food Stamps
Receiving Food Stamps Comparison
Assyrians/Chaldeans/Syriacs
Immigrants from Cambodia
10.6%
RECEIVING FOOD STAMPS
94.1/ 100
METRIC RATING
118th/ 347
METRIC RANK
13.9%
RECEIVING FOOD STAMPS
0.5/ 100
METRIC RATING
250th/ 347
METRIC RANK
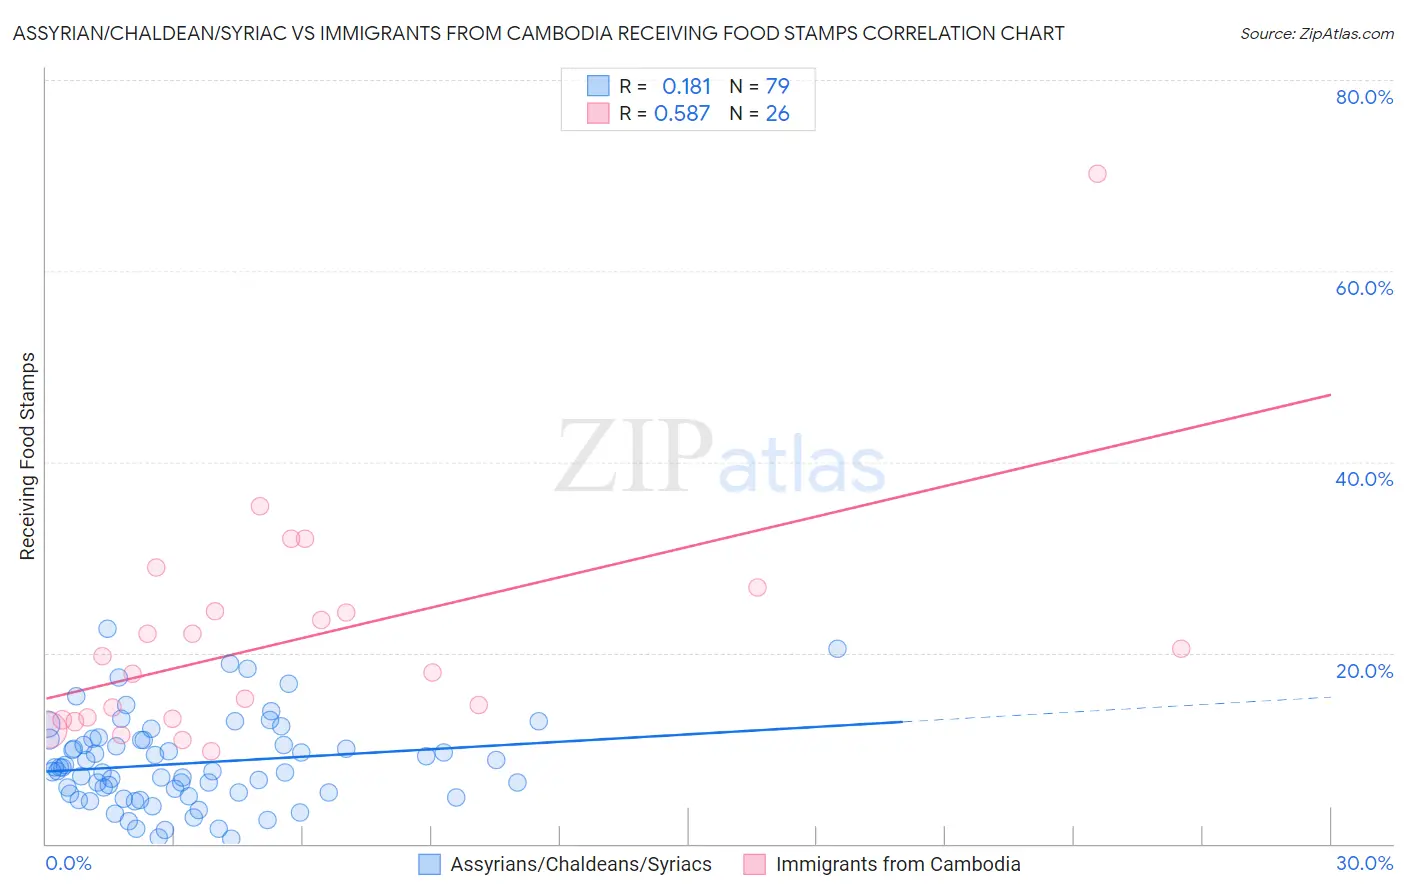
Assyrian/Chaldean/Syriac vs Immigrants from Cambodia Receiving Food Stamps Correlation Chart
The statistical analysis conducted on geographies consisting of 110,240,637 people shows a poor positive correlation between the proportion of Assyrians/Chaldeans/Syriacs and percentage of population receiving government assistance and/or food stamps in the United States with a correlation coefficient (R) of 0.181 and weighted average of 10.6%. Similarly, the statistical analysis conducted on geographies consisting of 205,011,401 people shows a substantial positive correlation between the proportion of Immigrants from Cambodia and percentage of population receiving government assistance and/or food stamps in the United States with a correlation coefficient (R) of 0.587 and weighted average of 13.9%, a difference of 31.0%.
Receiving Food Stamps Correlation Summary
| Measurement | Assyrian/Chaldean/Syriac | Immigrants from Cambodia |
| Minimum | 0.50% | 9.7% |
| Maximum | 22.5% | 70.2% |
| Range | 22.0% | 60.5% |
| Mean | 8.4% | 21.4% |
| Median | 7.6% | 18.8% |
| Interquartile 25% (IQ1) | 5.2% | 13.1% |
| Interquartile 75% (IQ3) | 10.9% | 24.3% |
| Interquartile Range (IQR) | 5.7% | 11.2% |
| Standard Deviation (Sample) | 4.6% | 12.3% |
| Standard Deviation (Population) | 4.6% | 12.1% |
Similar Demographics by Receiving Food Stamps
Demographics Similar to Assyrians/Chaldeans/Syriacs by Receiving Food Stamps
In terms of receiving food stamps, the demographic groups most similar to Assyrians/Chaldeans/Syriacs are Immigrants from Poland (10.6%, a difference of 0.16%), Ethiopian (10.6%, a difference of 0.17%), Slavic (10.6%, a difference of 0.20%), Sri Lankan (10.6%, a difference of 0.27%), and Immigrants from Nepal (10.6%, a difference of 0.34%).
| Demographics | Rating | Rank | Receiving Food Stamps |
| Romanians | 95.8 /100 | #111 | Exceptional 10.4% |
| Mongolians | 95.8 /100 | #112 | Exceptional 10.5% |
| Icelanders | 95.4 /100 | #113 | Exceptional 10.5% |
| Scotch-Irish | 95.1 /100 | #114 | Exceptional 10.5% |
| Immigrants | Saudi Arabia | 94.9 /100 | #115 | Exceptional 10.5% |
| Canadians | 94.8 /100 | #116 | Exceptional 10.5% |
| Immigrants | Nepal | 94.6 /100 | #117 | Exceptional 10.6% |
| Assyrians/Chaldeans/Syriacs | 94.1 /100 | #118 | Exceptional 10.6% |
| Immigrants | Poland | 93.9 /100 | #119 | Exceptional 10.6% |
| Ethiopians | 93.9 /100 | #120 | Exceptional 10.6% |
| Slavs | 93.8 /100 | #121 | Exceptional 10.6% |
| Sri Lankans | 93.7 /100 | #122 | Exceptional 10.6% |
| Immigrants | Philippines | 93.3 /100 | #123 | Exceptional 10.7% |
| Paraguayans | 93.0 /100 | #124 | Exceptional 10.7% |
| Ukrainians | 92.8 /100 | #125 | Exceptional 10.7% |
Demographics Similar to Immigrants from Cambodia by Receiving Food Stamps
In terms of receiving food stamps, the demographic groups most similar to Immigrants from Cambodia are Yaqui (13.9%, a difference of 0.070%), Indonesian (13.9%, a difference of 0.17%), Ghanaian (14.0%, a difference of 0.52%), Immigrants from Laos (13.8%, a difference of 0.80%), and Spanish American (14.0%, a difference of 0.89%).
| Demographics | Rating | Rank | Receiving Food Stamps |
| Somalis | 0.9 /100 | #243 | Tragic 13.7% |
| Cajuns | 0.9 /100 | #244 | Tragic 13.7% |
| Immigrants | Somalia | 0.9 /100 | #245 | Tragic 13.7% |
| Cree | 0.8 /100 | #246 | Tragic 13.7% |
| Mexican American Indians | 0.7 /100 | #247 | Tragic 13.8% |
| Immigrants | Laos | 0.7 /100 | #248 | Tragic 13.8% |
| Indonesians | 0.6 /100 | #249 | Tragic 13.9% |
| Immigrants | Cambodia | 0.5 /100 | #250 | Tragic 13.9% |
| Yaqui | 0.5 /100 | #251 | Tragic 13.9% |
| Ghanaians | 0.5 /100 | #252 | Tragic 14.0% |
| Spanish Americans | 0.4 /100 | #253 | Tragic 14.0% |
| Marshallese | 0.3 /100 | #254 | Tragic 14.1% |
| Sub-Saharan Africans | 0.3 /100 | #255 | Tragic 14.1% |
| Japanese | 0.3 /100 | #256 | Tragic 14.1% |
| Arapaho | 0.3 /100 | #257 | Tragic 14.1% |