Liberian vs Immigrants from Denmark Receiving Food Stamps
COMPARE
Liberian
Immigrants from Denmark
Receiving Food Stamps
Receiving Food Stamps Comparison
Liberians
Immigrants from Denmark
14.8%
RECEIVING FOOD STAMPS
0.1/ 100
METRIC RATING
276th/ 347
METRIC RANK
9.6%
RECEIVING FOOD STAMPS
99.4/ 100
METRIC RATING
44th/ 347
METRIC RANK
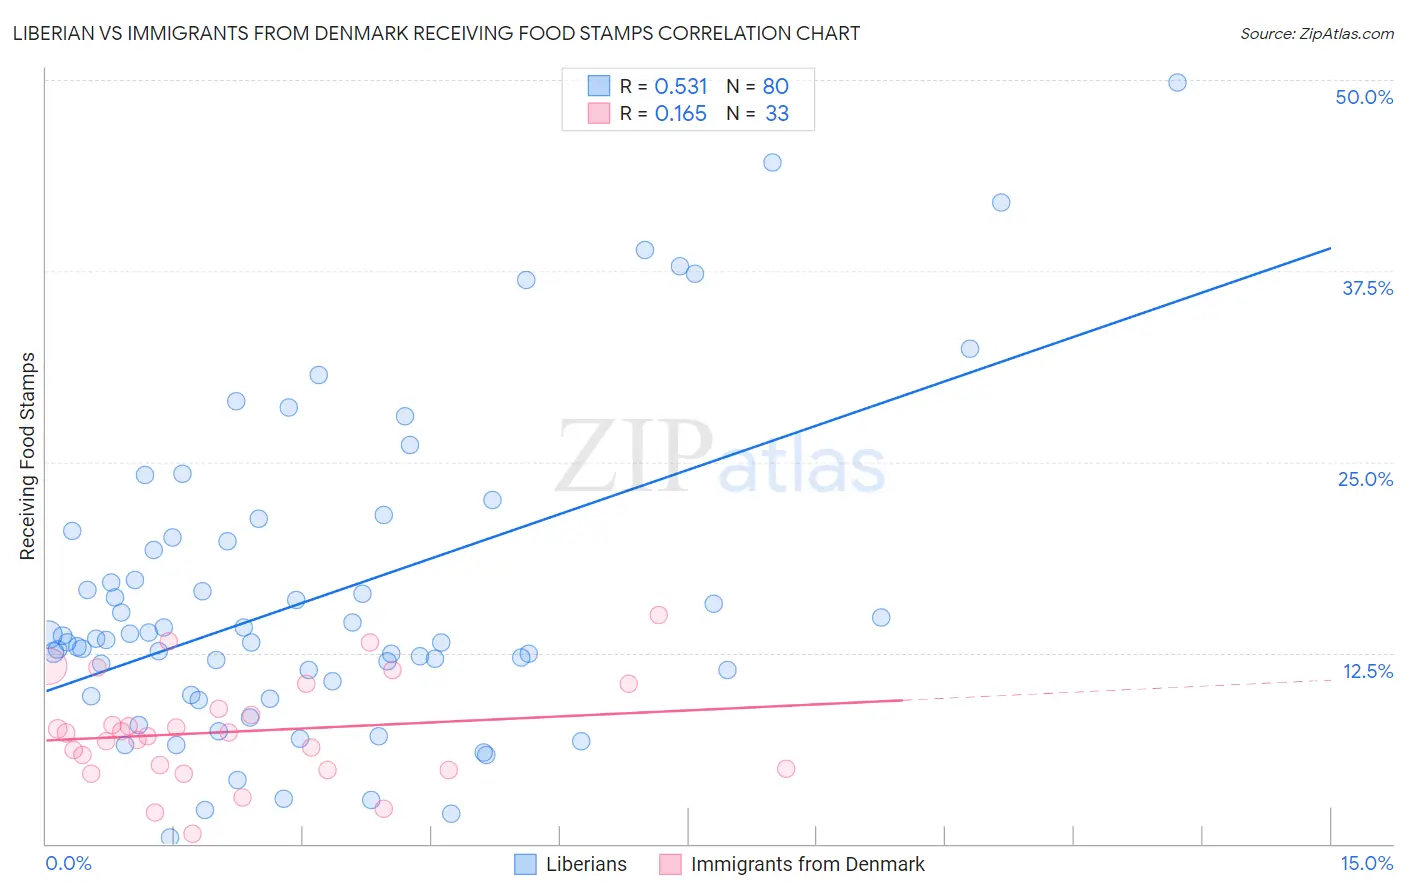
Liberian vs Immigrants from Denmark Receiving Food Stamps Correlation Chart
The statistical analysis conducted on geographies consisting of 118,008,708 people shows a substantial positive correlation between the proportion of Liberians and percentage of population receiving government assistance and/or food stamps in the United States with a correlation coefficient (R) of 0.531 and weighted average of 14.8%. Similarly, the statistical analysis conducted on geographies consisting of 136,213,097 people shows a poor positive correlation between the proportion of Immigrants from Denmark and percentage of population receiving government assistance and/or food stamps in the United States with a correlation coefficient (R) of 0.165 and weighted average of 9.6%, a difference of 54.0%.
Receiving Food Stamps Correlation Summary
| Measurement | Liberian | Immigrants from Denmark |
| Minimum | 0.40% | 0.68% |
| Maximum | 49.8% | 15.0% |
| Range | 49.4% | 14.3% |
| Mean | 16.2% | 7.4% |
| Median | 13.4% | 7.3% |
| Interquartile 25% (IQ1) | 10.2% | 4.8% |
| Interquartile 75% (IQ3) | 19.9% | 9.7% |
| Interquartile Range (IQR) | 9.7% | 4.8% |
| Standard Deviation (Sample) | 10.3% | 3.4% |
| Standard Deviation (Population) | 10.2% | 3.3% |
Similar Demographics by Receiving Food Stamps
Demographics Similar to Liberians by Receiving Food Stamps
In terms of receiving food stamps, the demographic groups most similar to Liberians are Seminole (14.8%, a difference of 0.050%), Belizean (14.8%, a difference of 0.18%), Kiowa (14.9%, a difference of 0.45%), Ecuadorian (14.9%, a difference of 0.50%), and Ute (14.7%, a difference of 0.71%).
| Demographics | Rating | Rank | Receiving Food Stamps |
| Nepalese | 0.1 /100 | #269 | Tragic 14.6% |
| Mexicans | 0.1 /100 | #270 | Tragic 14.6% |
| Immigrants | Guatemala | 0.1 /100 | #271 | Tragic 14.6% |
| Chippewa | 0.1 /100 | #272 | Tragic 14.7% |
| Alaskan Athabascans | 0.1 /100 | #273 | Tragic 14.7% |
| Immigrants | Western Africa | 0.1 /100 | #274 | Tragic 14.7% |
| Ute | 0.1 /100 | #275 | Tragic 14.7% |
| Liberians | 0.1 /100 | #276 | Tragic 14.8% |
| Seminole | 0.1 /100 | #277 | Tragic 14.8% |
| Belizeans | 0.1 /100 | #278 | Tragic 14.8% |
| Kiowa | 0.0 /100 | #279 | Tragic 14.9% |
| Ecuadorians | 0.0 /100 | #280 | Tragic 14.9% |
| Spanish American Indians | 0.0 /100 | #281 | Tragic 14.9% |
| Immigrants | Central America | 0.0 /100 | #282 | Tragic 15.0% |
| Bangladeshis | 0.0 /100 | #283 | Tragic 15.0% |
Demographics Similar to Immigrants from Denmark by Receiving Food Stamps
In terms of receiving food stamps, the demographic groups most similar to Immigrants from Denmark are Immigrants from Belgium (9.6%, a difference of 0.030%), Australian (9.6%, a difference of 0.11%), Indian (Asian) (9.6%, a difference of 0.17%), Croatian (9.6%, a difference of 0.23%), and Russian (9.6%, a difference of 0.28%).
| Demographics | Rating | Rank | Receiving Food Stamps |
| Europeans | 99.6 /100 | #37 | Exceptional 9.5% |
| Immigrants | Sri Lanka | 99.5 /100 | #38 | Exceptional 9.5% |
| Immigrants | Bolivia | 99.5 /100 | #39 | Exceptional 9.5% |
| Immigrants | Netherlands | 99.5 /100 | #40 | Exceptional 9.5% |
| Cambodians | 99.5 /100 | #41 | Exceptional 9.5% |
| Immigrants | China | 99.5 /100 | #42 | Exceptional 9.6% |
| Croatians | 99.5 /100 | #43 | Exceptional 9.6% |
| Immigrants | Denmark | 99.4 /100 | #44 | Exceptional 9.6% |
| Immigrants | Belgium | 99.4 /100 | #45 | Exceptional 9.6% |
| Australians | 99.4 /100 | #46 | Exceptional 9.6% |
| Indians (Asian) | 99.4 /100 | #47 | Exceptional 9.6% |
| Russians | 99.4 /100 | #48 | Exceptional 9.6% |
| Immigrants | Czechoslovakia | 99.4 /100 | #49 | Exceptional 9.6% |
| Lithuanians | 99.4 /100 | #50 | Exceptional 9.7% |
| Asians | 99.3 /100 | #51 | Exceptional 9.7% |