Vietnamese vs Aleut Child Poverty Among Girls Under 16
COMPARE
Vietnamese
Aleut
Child Poverty Among Girls Under 16
Child Poverty Among Girls Under 16 Comparison
Vietnamese
Aleuts
19.5%
CHILD POVERTY AMONG GIRLS UNDER 16
0.2/ 100
METRIC RATING
261st/ 347
METRIC RANK
16.9%
CHILD POVERTY AMONG GIRLS UNDER 16
28.7/ 100
METRIC RATING
193rd/ 347
METRIC RANK
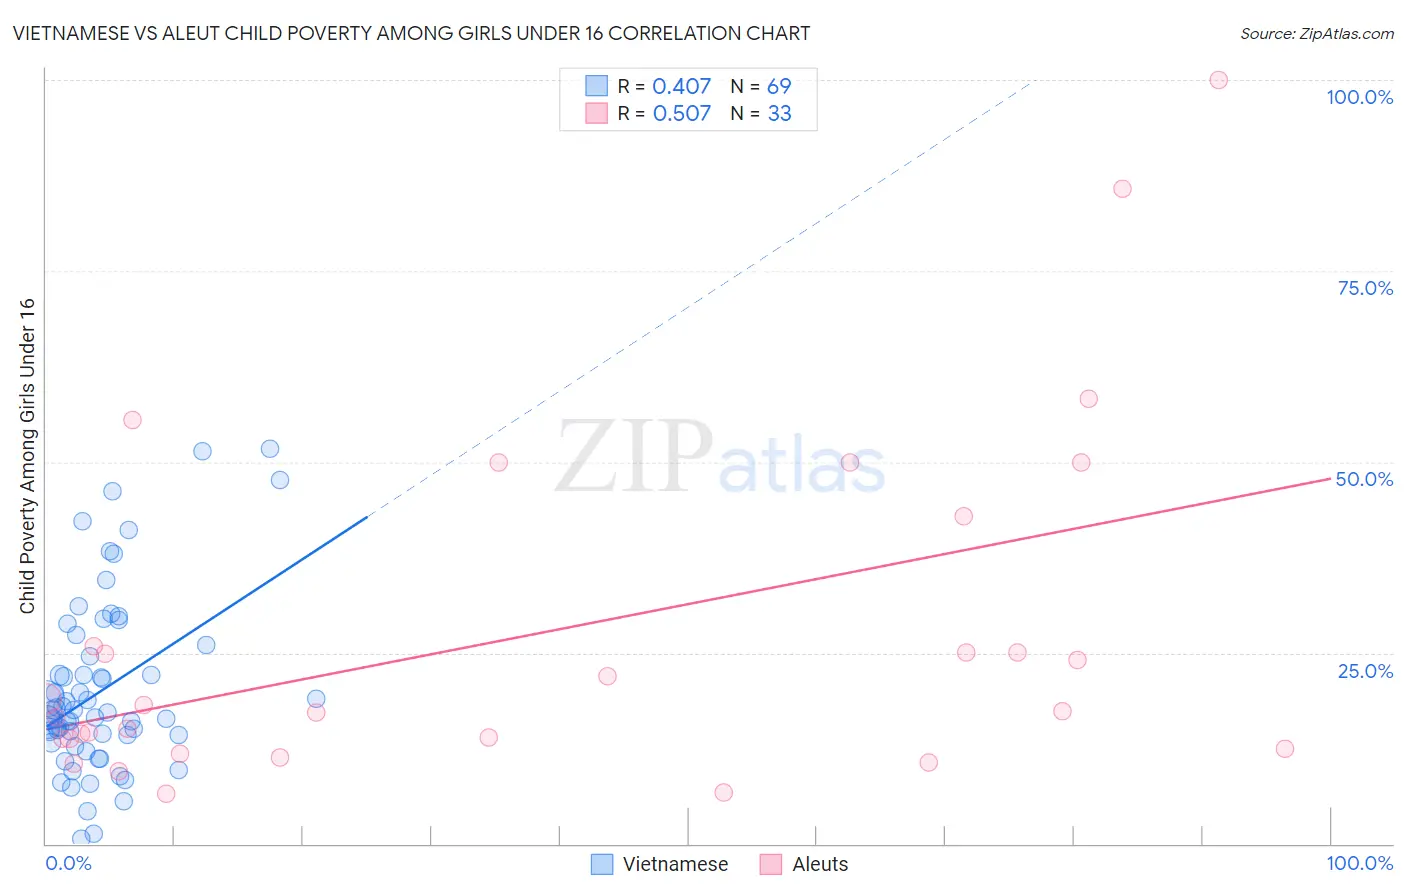
Vietnamese vs Aleut Child Poverty Among Girls Under 16 Correlation Chart
The statistical analysis conducted on geographies consisting of 169,480,173 people shows a moderate positive correlation between the proportion of Vietnamese and poverty level among girls under the age of 16 in the United States with a correlation coefficient (R) of 0.407 and weighted average of 19.5%. Similarly, the statistical analysis conducted on geographies consisting of 61,541,696 people shows a substantial positive correlation between the proportion of Aleuts and poverty level among girls under the age of 16 in the United States with a correlation coefficient (R) of 0.507 and weighted average of 16.9%, a difference of 15.6%.
Child Poverty Among Girls Under 16 Correlation Summary
| Measurement | Vietnamese | Aleut |
| Minimum | 0.61% | 6.6% |
| Maximum | 51.8% | 100.0% |
| Range | 51.2% | 93.4% |
| Mean | 20.1% | 27.1% |
| Median | 17.1% | 17.4% |
| Interquartile 25% (IQ1) | 13.8% | 13.1% |
| Interquartile 75% (IQ3) | 25.3% | 34.4% |
| Interquartile Range (IQR) | 11.6% | 21.3% |
| Standard Deviation (Sample) | 11.4% | 22.5% |
| Standard Deviation (Population) | 11.3% | 22.2% |
Similar Demographics by Child Poverty Among Girls Under 16
Demographics Similar to Vietnamese by Child Poverty Among Girls Under 16
In terms of child poverty among girls under 16, the demographic groups most similar to Vietnamese are Mexican American Indian (19.5%, a difference of 0.090%), Chickasaw (19.6%, a difference of 0.52%), Immigrants from Burma/Myanmar (19.7%, a difference of 0.64%), Ottawa (19.4%, a difference of 0.67%), and Jamaican (19.7%, a difference of 0.76%).
| Demographics | Rating | Rank | Child Poverty Among Girls Under 16 |
| Immigrants | Western Africa | 0.3 /100 | #254 | Tragic 19.3% |
| Immigrants | Ecuador | 0.3 /100 | #255 | Tragic 19.3% |
| Trinidadians and Tobagonians | 0.2 /100 | #256 | Tragic 19.3% |
| Guyanese | 0.2 /100 | #257 | Tragic 19.4% |
| Salvadorans | 0.2 /100 | #258 | Tragic 19.4% |
| Ottawa | 0.2 /100 | #259 | Tragic 19.4% |
| Mexican American Indians | 0.2 /100 | #260 | Tragic 19.5% |
| Vietnamese | 0.2 /100 | #261 | Tragic 19.5% |
| Chickasaw | 0.1 /100 | #262 | Tragic 19.6% |
| Immigrants | Burma/Myanmar | 0.1 /100 | #263 | Tragic 19.7% |
| Jamaicans | 0.1 /100 | #264 | Tragic 19.7% |
| Immigrants | Jamaica | 0.1 /100 | #265 | Tragic 19.8% |
| Spanish Americans | 0.1 /100 | #266 | Tragic 19.8% |
| Immigrants | Bangladesh | 0.1 /100 | #267 | Tragic 19.9% |
| Spanish American Indians | 0.1 /100 | #268 | Tragic 19.9% |
Demographics Similar to Aleuts by Child Poverty Among Girls Under 16
In terms of child poverty among girls under 16, the demographic groups most similar to Aleuts are Spanish (16.9%, a difference of 0.010%), Immigrants from Uganda (16.8%, a difference of 0.34%), Immigrants from the Azores (16.8%, a difference of 0.35%), Immigrants from Costa Rica (17.0%, a difference of 0.44%), and Kenyan (16.8%, a difference of 0.47%).
| Demographics | Rating | Rank | Child Poverty Among Girls Under 16 |
| South American Indians | 35.0 /100 | #186 | Fair 16.8% |
| Immigrants | Morocco | 34.6 /100 | #187 | Fair 16.8% |
| Arabs | 34.5 /100 | #188 | Fair 16.8% |
| Immigrants | Bosnia and Herzegovina | 32.5 /100 | #189 | Fair 16.8% |
| Kenyans | 32.3 /100 | #190 | Fair 16.8% |
| Immigrants | Azores | 31.3 /100 | #191 | Fair 16.8% |
| Immigrants | Uganda | 31.3 /100 | #192 | Fair 16.8% |
| Aleuts | 28.7 /100 | #193 | Fair 16.9% |
| Spanish | 28.6 /100 | #194 | Fair 16.9% |
| Immigrants | Costa Rica | 25.6 /100 | #195 | Fair 17.0% |
| Celtics | 25.2 /100 | #196 | Fair 17.0% |
| Spaniards | 24.9 /100 | #197 | Fair 17.0% |
| Immigrants | Lebanon | 22.6 /100 | #198 | Fair 17.1% |
| Immigrants | Afghanistan | 22.4 /100 | #199 | Fair 17.1% |
| Immigrants | Uzbekistan | 21.5 /100 | #200 | Fair 17.1% |