Ghanaian vs Aleut Child Poverty Among Girls Under 16
COMPARE
Ghanaian
Aleut
Child Poverty Among Girls Under 16
Child Poverty Among Girls Under 16 Comparison
Ghanaians
Aleuts
18.5%
CHILD POVERTY AMONG GIRLS UNDER 16
1.4/ 100
METRIC RATING
229th/ 347
METRIC RANK
16.9%
CHILD POVERTY AMONG GIRLS UNDER 16
28.7/ 100
METRIC RATING
193rd/ 347
METRIC RANK
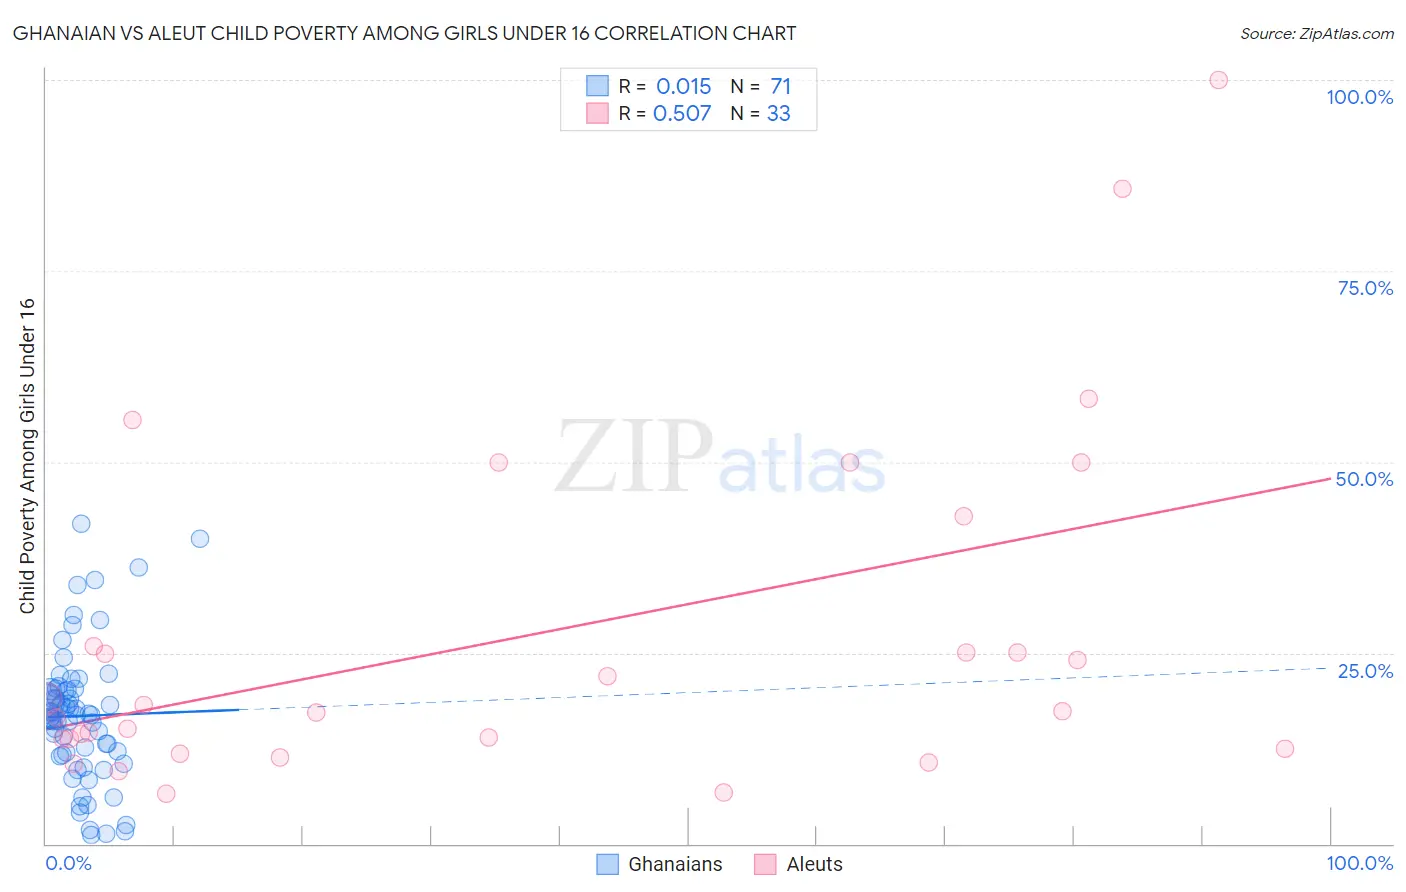
Ghanaian vs Aleut Child Poverty Among Girls Under 16 Correlation Chart
The statistical analysis conducted on geographies consisting of 189,052,408 people shows no correlation between the proportion of Ghanaians and poverty level among girls under the age of 16 in the United States with a correlation coefficient (R) of 0.015 and weighted average of 18.5%. Similarly, the statistical analysis conducted on geographies consisting of 61,541,696 people shows a substantial positive correlation between the proportion of Aleuts and poverty level among girls under the age of 16 in the United States with a correlation coefficient (R) of 0.507 and weighted average of 16.9%, a difference of 9.4%.
Child Poverty Among Girls Under 16 Correlation Summary
| Measurement | Ghanaian | Aleut |
| Minimum | 1.1% | 6.6% |
| Maximum | 41.8% | 100.0% |
| Range | 40.7% | 93.4% |
| Mean | 16.7% | 27.1% |
| Median | 16.8% | 17.4% |
| Interquartile 25% (IQ1) | 11.7% | 13.1% |
| Interquartile 75% (IQ3) | 20.2% | 34.4% |
| Interquartile Range (IQR) | 8.6% | 21.3% |
| Standard Deviation (Sample) | 8.7% | 22.5% |
| Standard Deviation (Population) | 8.6% | 22.2% |
Similar Demographics by Child Poverty Among Girls Under 16
Demographics Similar to Ghanaians by Child Poverty Among Girls Under 16
In terms of child poverty among girls under 16, the demographic groups most similar to Ghanaians are Osage (18.5%, a difference of 0.19%), Cree (18.5%, a difference of 0.27%), Immigrants from Sudan (18.6%, a difference of 0.52%), Sudanese (18.6%, a difference of 0.56%), and Fijian (18.6%, a difference of 0.63%).
| Demographics | Rating | Rank | Child Poverty Among Girls Under 16 |
| Immigrants | Cambodia | 2.9 /100 | #222 | Tragic 18.1% |
| Immigrants | Armenia | 2.9 /100 | #223 | Tragic 18.1% |
| Bermudans | 2.8 /100 | #224 | Tragic 18.1% |
| Immigrants | Africa | 2.7 /100 | #225 | Tragic 18.2% |
| Nicaraguans | 2.4 /100 | #226 | Tragic 18.2% |
| Immigrants | Nonimmigrants | 2.0 /100 | #227 | Tragic 18.3% |
| Alaskan Athabascans | 2.0 /100 | #228 | Tragic 18.3% |
| Ghanaians | 1.4 /100 | #229 | Tragic 18.5% |
| Osage | 1.3 /100 | #230 | Tragic 18.5% |
| Cree | 1.3 /100 | #231 | Tragic 18.5% |
| Immigrants | Sudan | 1.1 /100 | #232 | Tragic 18.6% |
| Sudanese | 1.1 /100 | #233 | Tragic 18.6% |
| Fijians | 1.1 /100 | #234 | Tragic 18.6% |
| Nepalese | 1.1 /100 | #235 | Tragic 18.6% |
| Alsatians | 1.1 /100 | #236 | Tragic 18.6% |
Demographics Similar to Aleuts by Child Poverty Among Girls Under 16
In terms of child poverty among girls under 16, the demographic groups most similar to Aleuts are Spanish (16.9%, a difference of 0.010%), Immigrants from Uganda (16.8%, a difference of 0.34%), Immigrants from the Azores (16.8%, a difference of 0.35%), Immigrants from Costa Rica (17.0%, a difference of 0.44%), and Kenyan (16.8%, a difference of 0.47%).
| Demographics | Rating | Rank | Child Poverty Among Girls Under 16 |
| South American Indians | 35.0 /100 | #186 | Fair 16.8% |
| Immigrants | Morocco | 34.6 /100 | #187 | Fair 16.8% |
| Arabs | 34.5 /100 | #188 | Fair 16.8% |
| Immigrants | Bosnia and Herzegovina | 32.5 /100 | #189 | Fair 16.8% |
| Kenyans | 32.3 /100 | #190 | Fair 16.8% |
| Immigrants | Azores | 31.3 /100 | #191 | Fair 16.8% |
| Immigrants | Uganda | 31.3 /100 | #192 | Fair 16.8% |
| Aleuts | 28.7 /100 | #193 | Fair 16.9% |
| Spanish | 28.6 /100 | #194 | Fair 16.9% |
| Immigrants | Costa Rica | 25.6 /100 | #195 | Fair 17.0% |
| Celtics | 25.2 /100 | #196 | Fair 17.0% |
| Spaniards | 24.9 /100 | #197 | Fair 17.0% |
| Immigrants | Lebanon | 22.6 /100 | #198 | Fair 17.1% |
| Immigrants | Afghanistan | 22.4 /100 | #199 | Fair 17.1% |
| Immigrants | Uzbekistan | 21.5 /100 | #200 | Fair 17.1% |