Asian vs Chippewa Single Father Poverty
COMPARE
Asian
Chippewa
Single Father Poverty
Single Father Poverty Comparison
Asians
Chippewa
14.6%
SINGLE FATHER POVERTY
100.0/ 100
METRIC RATING
32nd/ 347
METRIC RANK
18.8%
SINGLE FATHER POVERTY
0.0/ 100
METRIC RATING
310th/ 347
METRIC RANK
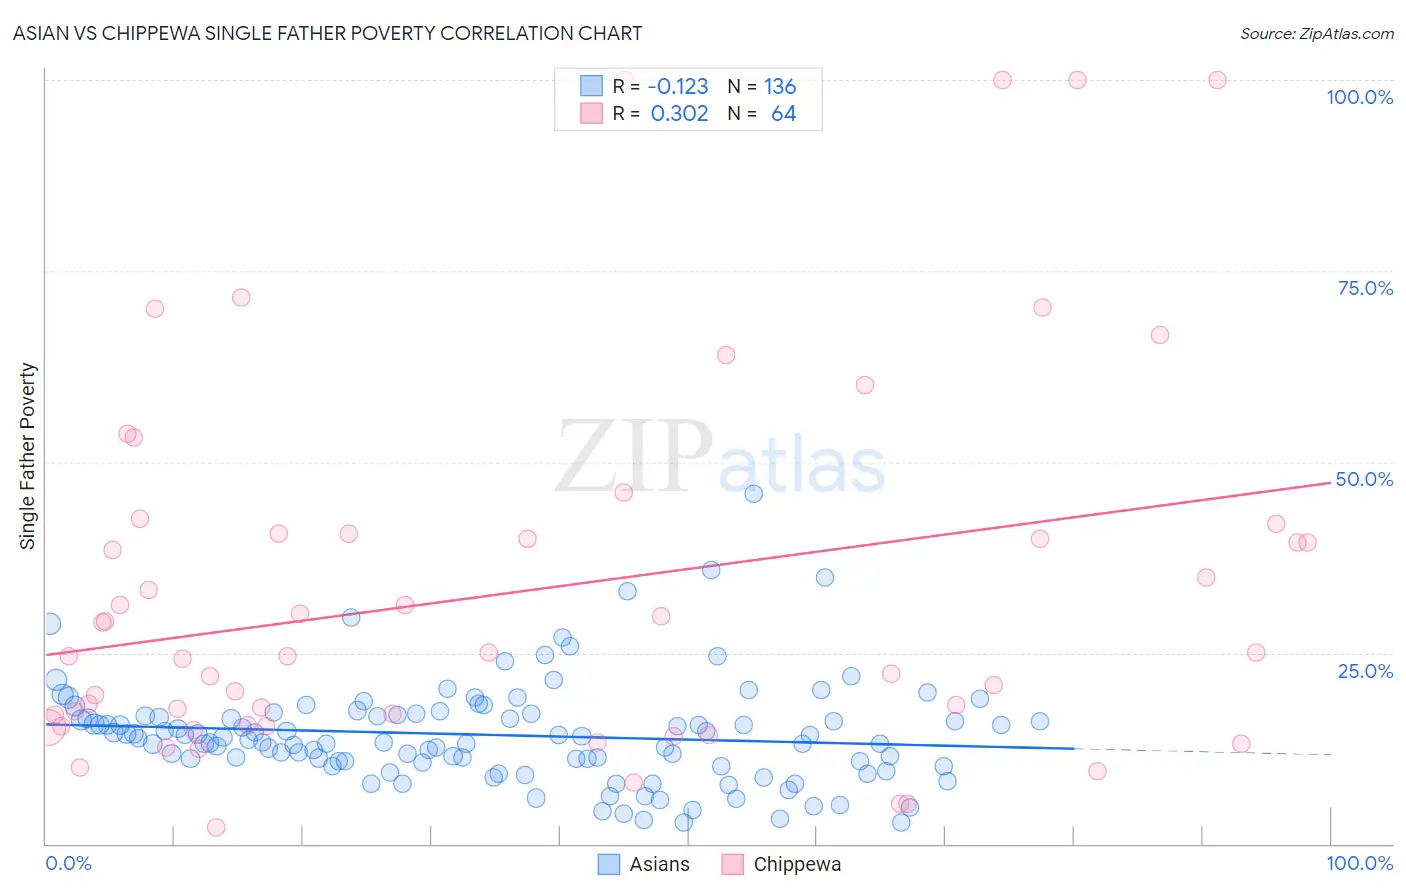
Asian vs Chippewa Single Father Poverty Correlation Chart
The statistical analysis conducted on geographies consisting of 402,614,567 people shows a poor negative correlation between the proportion of Asians and poverty level among single fathers in the United States with a correlation coefficient (R) of -0.123 and weighted average of 14.6%. Similarly, the statistical analysis conducted on geographies consisting of 183,159,389 people shows a mild positive correlation between the proportion of Chippewa and poverty level among single fathers in the United States with a correlation coefficient (R) of 0.302 and weighted average of 18.8%, a difference of 29.2%.
Single Father Poverty Correlation Summary
| Measurement | Asian | Chippewa |
| Minimum | 2.7% | 2.1% |
| Maximum | 45.8% | 100.0% |
| Range | 43.1% | 97.9% |
| Mean | 14.3% | 33.0% |
| Median | 13.7% | 24.8% |
| Interquartile 25% (IQ1) | 10.7% | 15.5% |
| Interquartile 75% (IQ3) | 16.8% | 40.6% |
| Interquartile Range (IQR) | 6.1% | 25.1% |
| Standard Deviation (Sample) | 6.7% | 24.4% |
| Standard Deviation (Population) | 6.7% | 24.2% |
Similar Demographics by Single Father Poverty
Demographics Similar to Asians by Single Father Poverty
In terms of single father poverty, the demographic groups most similar to Asians are Icelander (14.5%, a difference of 0.15%), Thai (14.5%, a difference of 0.24%), Somali (14.5%, a difference of 0.28%), Immigrants from South Central Asia (14.5%, a difference of 0.38%), and Okinawan (14.6%, a difference of 0.56%).
| Demographics | Rating | Rank | Single Father Poverty |
| Iranians | 100.0 /100 | #25 | Exceptional 14.4% |
| Spanish American Indians | 100.0 /100 | #26 | Exceptional 14.4% |
| Nepalese | 100.0 /100 | #27 | Exceptional 14.4% |
| Immigrants | South Central Asia | 100.0 /100 | #28 | Exceptional 14.5% |
| Somalis | 100.0 /100 | #29 | Exceptional 14.5% |
| Thais | 100.0 /100 | #30 | Exceptional 14.5% |
| Icelanders | 100.0 /100 | #31 | Exceptional 14.5% |
| Asians | 100.0 /100 | #32 | Exceptional 14.6% |
| Okinawans | 100.0 /100 | #33 | Exceptional 14.6% |
| Egyptians | 100.0 /100 | #34 | Exceptional 14.7% |
| Immigrants | Bolivia | 100.0 /100 | #35 | Exceptional 14.7% |
| Immigrants | Indonesia | 100.0 /100 | #36 | Exceptional 14.7% |
| Immigrants | Eastern Africa | 100.0 /100 | #37 | Exceptional 14.7% |
| Bolivians | 100.0 /100 | #38 | Exceptional 14.7% |
| Immigrants | Asia | 100.0 /100 | #39 | Exceptional 14.7% |
Demographics Similar to Chippewa by Single Father Poverty
In terms of single father poverty, the demographic groups most similar to Chippewa are Nonimmigrants (18.8%, a difference of 0.19%), Immigrants from Dominica (18.9%, a difference of 0.24%), Potawatomi (18.9%, a difference of 0.44%), Delaware (18.9%, a difference of 0.61%), and Chickasaw (19.0%, a difference of 0.76%).
| Demographics | Rating | Rank | Single Father Poverty |
| Celtics | 0.0 /100 | #303 | Tragic 18.5% |
| Ute | 0.0 /100 | #304 | Tragic 18.5% |
| Blackfeet | 0.0 /100 | #305 | Tragic 18.5% |
| Scotch-Irish | 0.0 /100 | #306 | Tragic 18.6% |
| French Canadians | 0.0 /100 | #307 | Tragic 18.6% |
| Ottawa | 0.0 /100 | #308 | Tragic 18.6% |
| Immigrants | Micronesia | 0.0 /100 | #309 | Tragic 18.6% |
| Chippewa | 0.0 /100 | #310 | Tragic 18.8% |
| Immigrants | Nonimmigrants | 0.0 /100 | #311 | Tragic 18.8% |
| Immigrants | Dominica | 0.0 /100 | #312 | Tragic 18.9% |
| Potawatomi | 0.0 /100 | #313 | Tragic 18.9% |
| Delaware | 0.0 /100 | #314 | Tragic 18.9% |
| Chickasaw | 0.0 /100 | #315 | Tragic 19.0% |
| Osage | 0.0 /100 | #316 | Tragic 19.0% |
| Dominicans | 0.0 /100 | #317 | Tragic 19.1% |