Immigrants from Singapore vs Chippewa Single Father Poverty
COMPARE
Immigrants from Singapore
Chippewa
Single Father Poverty
Single Father Poverty Comparison
Immigrants from Singapore
Chippewa
14.3%
SINGLE FATHER POVERTY
100.0/ 100
METRIC RATING
20th/ 347
METRIC RANK
18.8%
SINGLE FATHER POVERTY
0.0/ 100
METRIC RATING
310th/ 347
METRIC RANK
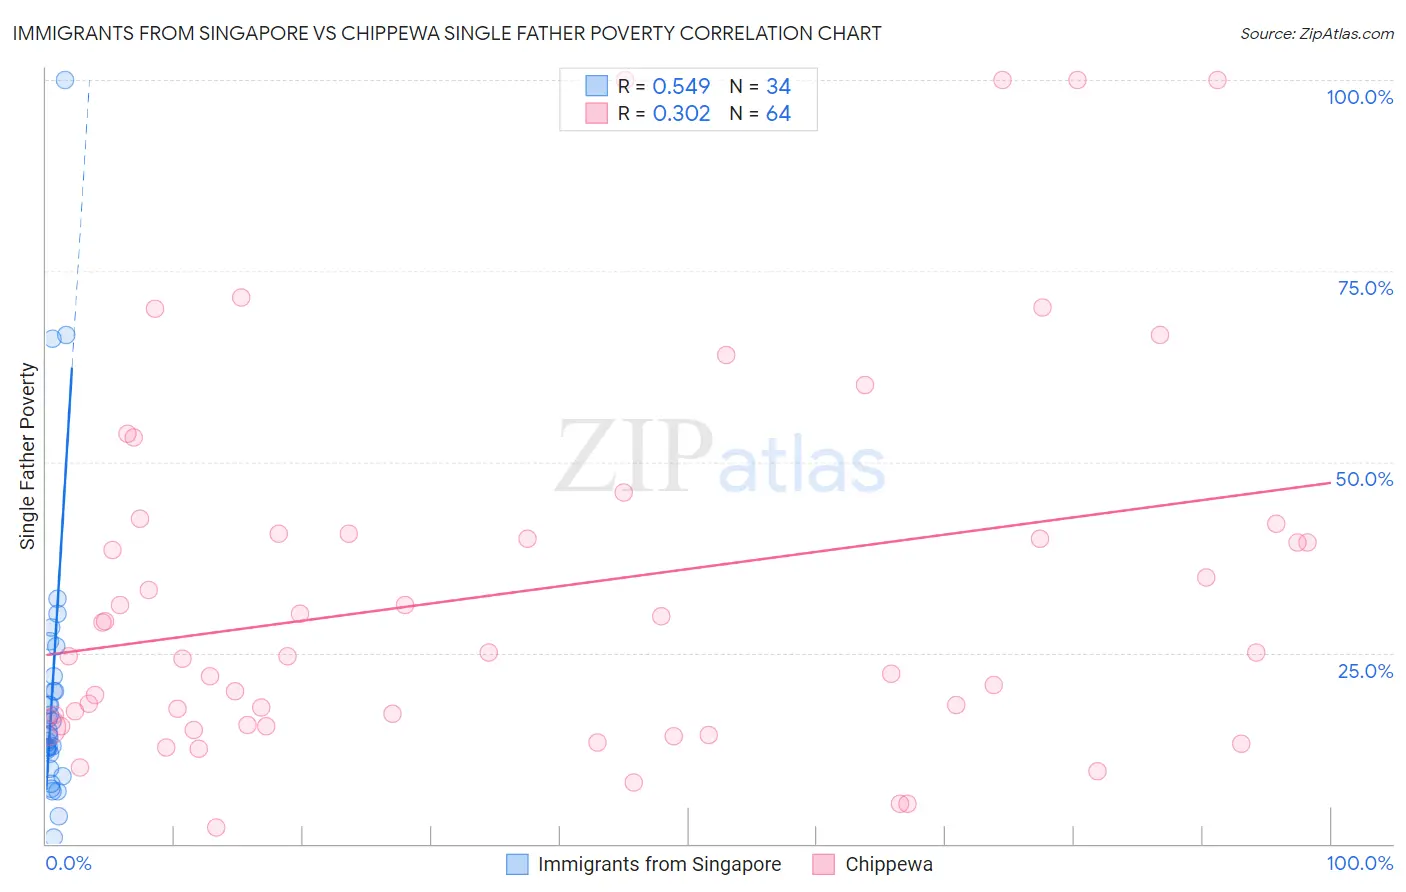
Immigrants from Singapore vs Chippewa Single Father Poverty Correlation Chart
The statistical analysis conducted on geographies consisting of 118,546,936 people shows a substantial positive correlation between the proportion of Immigrants from Singapore and poverty level among single fathers in the United States with a correlation coefficient (R) of 0.549 and weighted average of 14.3%. Similarly, the statistical analysis conducted on geographies consisting of 183,159,389 people shows a mild positive correlation between the proportion of Chippewa and poverty level among single fathers in the United States with a correlation coefficient (R) of 0.302 and weighted average of 18.8%, a difference of 31.9%.
Single Father Poverty Correlation Summary
| Measurement | Immigrants from Singapore | Chippewa |
| Minimum | 0.84% | 2.1% |
| Maximum | 100.0% | 100.0% |
| Range | 99.2% | 97.9% |
| Mean | 20.8% | 33.0% |
| Median | 14.5% | 24.8% |
| Interquartile 25% (IQ1) | 11.8% | 15.5% |
| Interquartile 75% (IQ3) | 21.9% | 40.6% |
| Interquartile Range (IQR) | 10.1% | 25.1% |
| Standard Deviation (Sample) | 19.9% | 24.4% |
| Standard Deviation (Population) | 19.6% | 24.2% |
Similar Demographics by Single Father Poverty
Demographics Similar to Immigrants from Singapore by Single Father Poverty
In terms of single father poverty, the demographic groups most similar to Immigrants from Singapore are Immigrants from Iraq (14.3%, a difference of 0.040%), Soviet Union (14.3%, a difference of 0.090%), Immigrants from Afghanistan (14.3%, a difference of 0.090%), Immigrants from Hong Kong (14.2%, a difference of 0.11%), and Taiwanese (14.3%, a difference of 0.43%).
| Demographics | Rating | Rank | Single Father Poverty |
| Immigrants | Philippines | 100.0 /100 | #13 | Exceptional 14.0% |
| Immigrants | Vietnam | 100.0 /100 | #14 | Exceptional 14.1% |
| Sri Lankans | 100.0 /100 | #15 | Exceptional 14.2% |
| Immigrants | Iran | 100.0 /100 | #16 | Exceptional 14.2% |
| Immigrants | Hong Kong | 100.0 /100 | #17 | Exceptional 14.2% |
| Soviet Union | 100.0 /100 | #18 | Exceptional 14.3% |
| Immigrants | Iraq | 100.0 /100 | #19 | Exceptional 14.3% |
| Immigrants | Singapore | 100.0 /100 | #20 | Exceptional 14.3% |
| Immigrants | Afghanistan | 100.0 /100 | #21 | Exceptional 14.3% |
| Taiwanese | 100.0 /100 | #22 | Exceptional 14.3% |
| Immigrants | Egypt | 100.0 /100 | #23 | Exceptional 14.4% |
| Immigrants | South Eastern Asia | 100.0 /100 | #24 | Exceptional 14.4% |
| Iranians | 100.0 /100 | #25 | Exceptional 14.4% |
| Spanish American Indians | 100.0 /100 | #26 | Exceptional 14.4% |
| Nepalese | 100.0 /100 | #27 | Exceptional 14.4% |
Demographics Similar to Chippewa by Single Father Poverty
In terms of single father poverty, the demographic groups most similar to Chippewa are Nonimmigrants (18.8%, a difference of 0.19%), Immigrants from Dominica (18.9%, a difference of 0.24%), Potawatomi (18.9%, a difference of 0.44%), Delaware (18.9%, a difference of 0.61%), and Chickasaw (19.0%, a difference of 0.76%).
| Demographics | Rating | Rank | Single Father Poverty |
| Celtics | 0.0 /100 | #303 | Tragic 18.5% |
| Ute | 0.0 /100 | #304 | Tragic 18.5% |
| Blackfeet | 0.0 /100 | #305 | Tragic 18.5% |
| Scotch-Irish | 0.0 /100 | #306 | Tragic 18.6% |
| French Canadians | 0.0 /100 | #307 | Tragic 18.6% |
| Ottawa | 0.0 /100 | #308 | Tragic 18.6% |
| Immigrants | Micronesia | 0.0 /100 | #309 | Tragic 18.6% |
| Chippewa | 0.0 /100 | #310 | Tragic 18.8% |
| Immigrants | Nonimmigrants | 0.0 /100 | #311 | Tragic 18.8% |
| Immigrants | Dominica | 0.0 /100 | #312 | Tragic 18.9% |
| Potawatomi | 0.0 /100 | #313 | Tragic 18.9% |
| Delaware | 0.0 /100 | #314 | Tragic 18.9% |
| Chickasaw | 0.0 /100 | #315 | Tragic 19.0% |
| Osage | 0.0 /100 | #316 | Tragic 19.0% |
| Dominicans | 0.0 /100 | #317 | Tragic 19.1% |