Asian vs Chippewa Receiving Food Stamps
COMPARE
Asian
Chippewa
Receiving Food Stamps
Receiving Food Stamps Comparison
Asians
Chippewa
9.7%
RECEIVING FOOD STAMPS
99.3/ 100
METRIC RATING
51st/ 347
METRIC RANK
14.7%
RECEIVING FOOD STAMPS
0.1/ 100
METRIC RATING
272nd/ 347
METRIC RANK
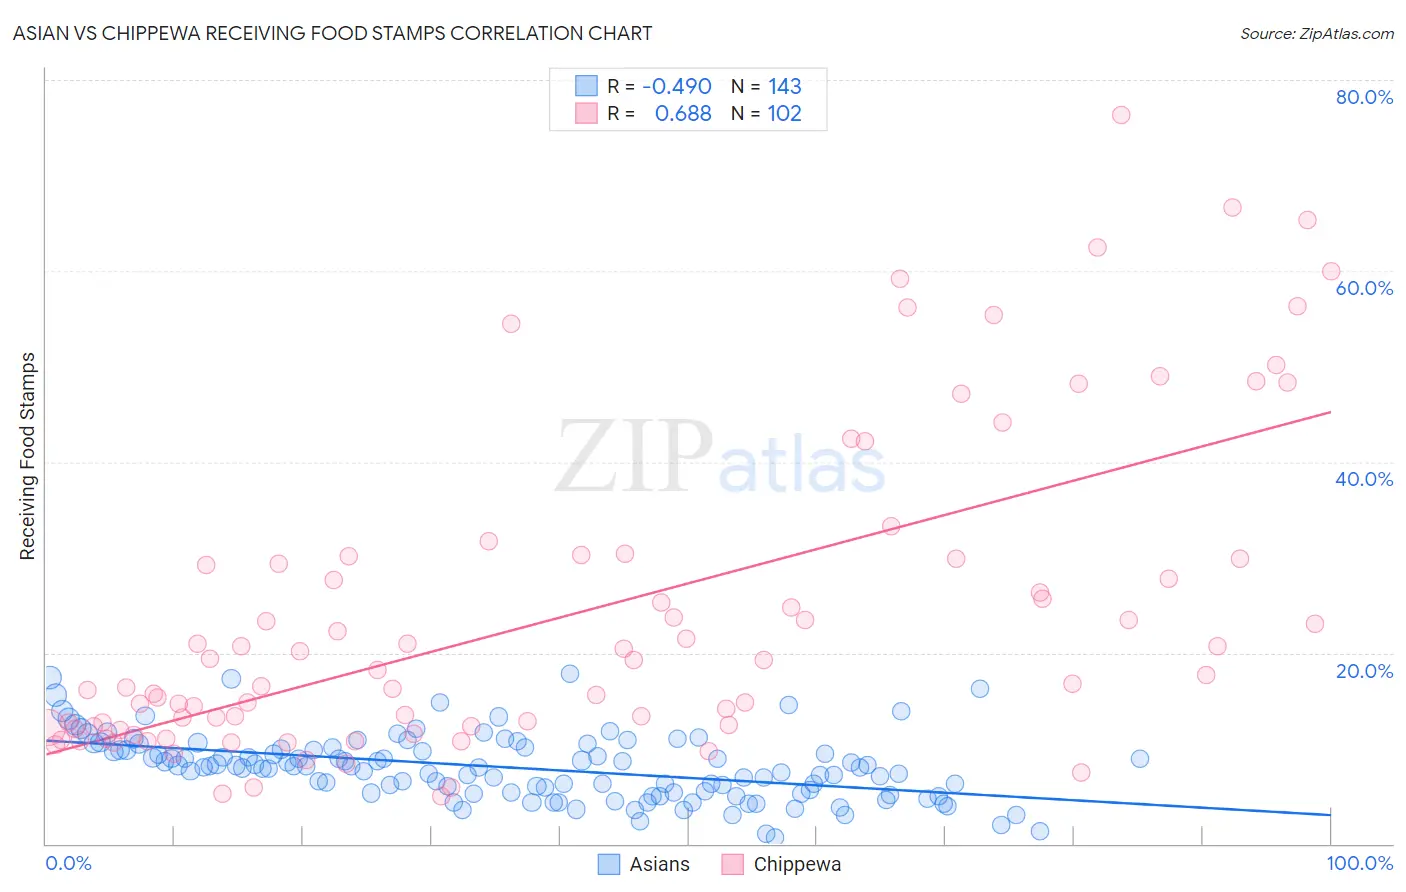
Asian vs Chippewa Receiving Food Stamps Correlation Chart
The statistical analysis conducted on geographies consisting of 547,774,062 people shows a moderate negative correlation between the proportion of Asians and percentage of population receiving government assistance and/or food stamps in the United States with a correlation coefficient (R) of -0.490 and weighted average of 9.7%. Similarly, the statistical analysis conducted on geographies consisting of 214,846,043 people shows a significant positive correlation between the proportion of Chippewa and percentage of population receiving government assistance and/or food stamps in the United States with a correlation coefficient (R) of 0.688 and weighted average of 14.7%, a difference of 51.6%.
Receiving Food Stamps Correlation Summary
| Measurement | Asian | Chippewa |
| Minimum | 0.60% | 5.0% |
| Maximum | 17.9% | 76.3% |
| Range | 17.3% | 71.3% |
| Mean | 8.0% | 24.0% |
| Median | 8.0% | 17.9% |
| Interquartile 25% (IQ1) | 5.3% | 12.3% |
| Interquartile 75% (IQ3) | 9.9% | 29.8% |
| Interquartile Range (IQR) | 4.6% | 17.5% |
| Standard Deviation (Sample) | 3.4% | 16.4% |
| Standard Deviation (Population) | 3.4% | 16.3% |
Similar Demographics by Receiving Food Stamps
Demographics Similar to Asians by Receiving Food Stamps
In terms of receiving food stamps, the demographic groups most similar to Asians are Immigrants from South Africa (9.7%, a difference of 0.010%), Tongan (9.7%, a difference of 0.030%), Swiss (9.7%, a difference of 0.15%), Immigrants from Switzerland (9.7%, a difference of 0.16%), and Lithuanian (9.7%, a difference of 0.18%).
| Demographics | Rating | Rank | Receiving Food Stamps |
| Immigrants | Denmark | 99.4 /100 | #44 | Exceptional 9.6% |
| Immigrants | Belgium | 99.4 /100 | #45 | Exceptional 9.6% |
| Australians | 99.4 /100 | #46 | Exceptional 9.6% |
| Indians (Asian) | 99.4 /100 | #47 | Exceptional 9.6% |
| Russians | 99.4 /100 | #48 | Exceptional 9.6% |
| Immigrants | Czechoslovakia | 99.4 /100 | #49 | Exceptional 9.6% |
| Lithuanians | 99.4 /100 | #50 | Exceptional 9.7% |
| Asians | 99.3 /100 | #51 | Exceptional 9.7% |
| Immigrants | South Africa | 99.3 /100 | #52 | Exceptional 9.7% |
| Tongans | 99.3 /100 | #53 | Exceptional 9.7% |
| Swiss | 99.3 /100 | #54 | Exceptional 9.7% |
| Immigrants | Switzerland | 99.3 /100 | #55 | Exceptional 9.7% |
| Immigrants | Canada | 99.3 /100 | #56 | Exceptional 9.7% |
| Greeks | 99.3 /100 | #57 | Exceptional 9.7% |
| Scandinavians | 99.2 /100 | #58 | Exceptional 9.7% |
Demographics Similar to Chippewa by Receiving Food Stamps
In terms of receiving food stamps, the demographic groups most similar to Chippewa are Alaskan Athabascan (14.7%, a difference of 0.030%), Immigrants from Western Africa (14.7%, a difference of 0.050%), Ute (14.7%, a difference of 0.13%), Immigrants from Guatemala (14.6%, a difference of 0.22%), and Mexican (14.6%, a difference of 0.32%).
| Demographics | Rating | Rank | Receiving Food Stamps |
| Blackfeet | 0.2 /100 | #265 | Tragic 14.3% |
| Cheyenne | 0.2 /100 | #266 | Tragic 14.3% |
| Dutch West Indians | 0.2 /100 | #267 | Tragic 14.3% |
| Guatemalans | 0.1 /100 | #268 | Tragic 14.4% |
| Nepalese | 0.1 /100 | #269 | Tragic 14.6% |
| Mexicans | 0.1 /100 | #270 | Tragic 14.6% |
| Immigrants | Guatemala | 0.1 /100 | #271 | Tragic 14.6% |
| Chippewa | 0.1 /100 | #272 | Tragic 14.7% |
| Alaskan Athabascans | 0.1 /100 | #273 | Tragic 14.7% |
| Immigrants | Western Africa | 0.1 /100 | #274 | Tragic 14.7% |
| Ute | 0.1 /100 | #275 | Tragic 14.7% |
| Liberians | 0.1 /100 | #276 | Tragic 14.8% |
| Seminole | 0.1 /100 | #277 | Tragic 14.8% |
| Belizeans | 0.1 /100 | #278 | Tragic 14.8% |
| Kiowa | 0.0 /100 | #279 | Tragic 14.9% |