Asian vs Immigrants from Vietnam Single Father Poverty
COMPARE
Asian
Immigrants from Vietnam
Single Father Poverty
Single Father Poverty Comparison
Asians
Immigrants from Vietnam
14.6%
SINGLE FATHER POVERTY
100.0/ 100
METRIC RATING
32nd/ 347
METRIC RANK
14.1%
SINGLE FATHER POVERTY
100.0/ 100
METRIC RATING
14th/ 347
METRIC RANK
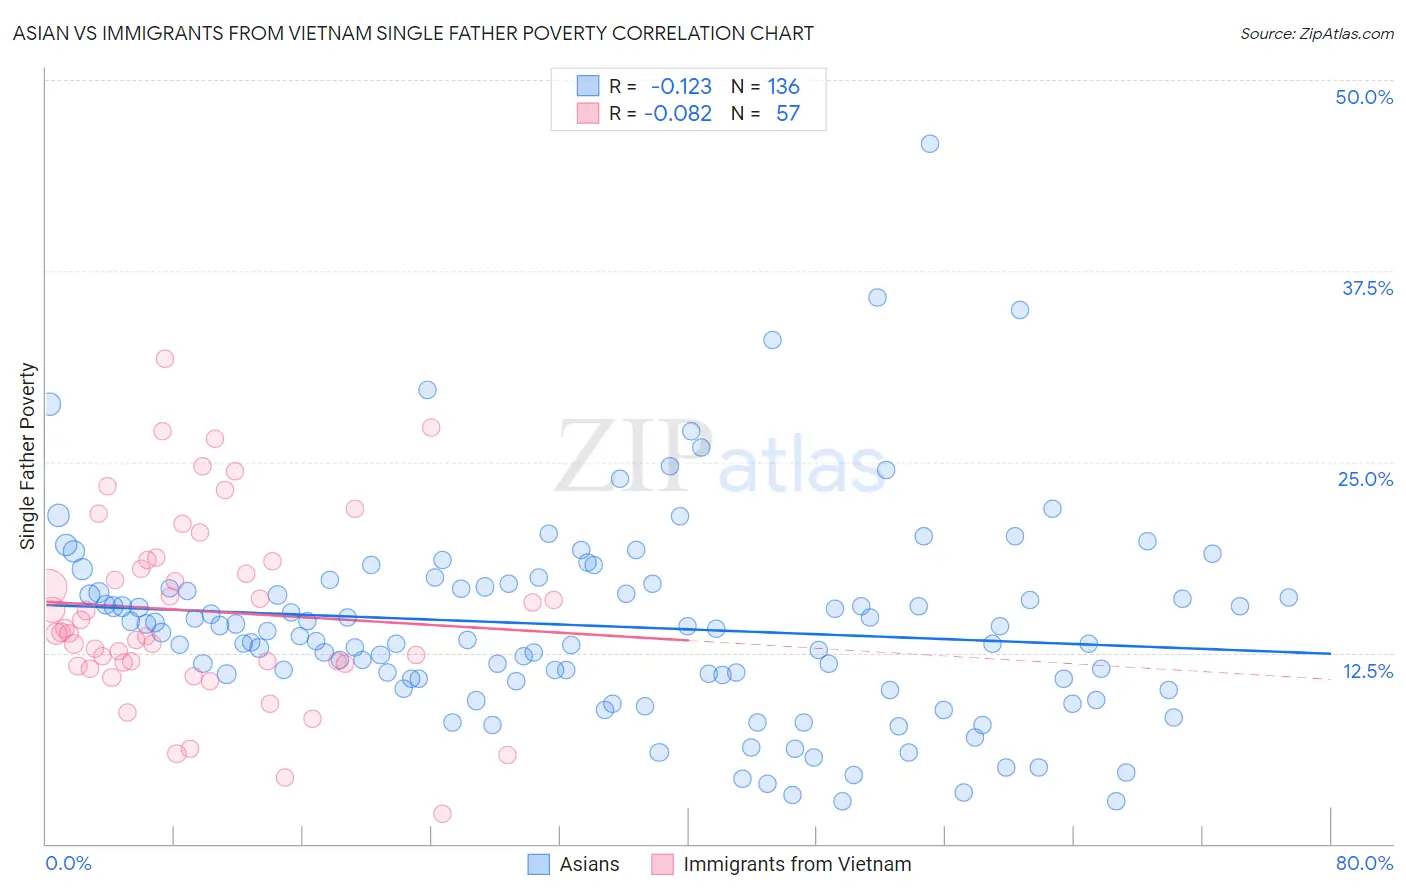
Asian vs Immigrants from Vietnam Single Father Poverty Correlation Chart
The statistical analysis conducted on geographies consisting of 402,614,567 people shows a poor negative correlation between the proportion of Asians and poverty level among single fathers in the United States with a correlation coefficient (R) of -0.123 and weighted average of 14.6%. Similarly, the statistical analysis conducted on geographies consisting of 320,936,660 people shows a slight negative correlation between the proportion of Immigrants from Vietnam and poverty level among single fathers in the United States with a correlation coefficient (R) of -0.082 and weighted average of 14.1%, a difference of 2.9%.
Single Father Poverty Correlation Summary
| Measurement | Asian | Immigrants from Vietnam |
| Minimum | 2.7% | 2.0% |
| Maximum | 45.8% | 31.8% |
| Range | 43.1% | 29.8% |
| Mean | 14.3% | 15.2% |
| Median | 13.7% | 13.8% |
| Interquartile 25% (IQ1) | 10.7% | 11.8% |
| Interquartile 75% (IQ3) | 16.8% | 18.5% |
| Interquartile Range (IQR) | 6.1% | 6.7% |
| Standard Deviation (Sample) | 6.7% | 6.1% |
| Standard Deviation (Population) | 6.7% | 6.0% |
Demographics Similar to Asians and Immigrants from Vietnam by Single Father Poverty
In terms of single father poverty, the demographic groups most similar to Asians are Icelander (14.5%, a difference of 0.15%), Thai (14.5%, a difference of 0.24%), Somali (14.5%, a difference of 0.28%), Immigrants from South Central Asia (14.5%, a difference of 0.38%), and Okinawan (14.6%, a difference of 0.56%). Similarly, the demographic groups most similar to Immigrants from Vietnam are Sri Lankan (14.2%, a difference of 0.050%), Immigrants from Iran (14.2%, a difference of 0.26%), Immigrants from Philippines (14.0%, a difference of 0.70%), Immigrants from Hong Kong (14.2%, a difference of 0.71%), and Soviet Union (14.3%, a difference of 0.74%).
| Demographics | Rating | Rank | Single Father Poverty |
| Immigrants | Philippines | 100.0 /100 | #13 | Exceptional 14.0% |
| Immigrants | Vietnam | 100.0 /100 | #14 | Exceptional 14.1% |
| Sri Lankans | 100.0 /100 | #15 | Exceptional 14.2% |
| Immigrants | Iran | 100.0 /100 | #16 | Exceptional 14.2% |
| Immigrants | Hong Kong | 100.0 /100 | #17 | Exceptional 14.2% |
| Soviet Union | 100.0 /100 | #18 | Exceptional 14.3% |
| Immigrants | Iraq | 100.0 /100 | #19 | Exceptional 14.3% |
| Immigrants | Singapore | 100.0 /100 | #20 | Exceptional 14.3% |
| Immigrants | Afghanistan | 100.0 /100 | #21 | Exceptional 14.3% |
| Taiwanese | 100.0 /100 | #22 | Exceptional 14.3% |
| Immigrants | Egypt | 100.0 /100 | #23 | Exceptional 14.4% |
| Immigrants | South Eastern Asia | 100.0 /100 | #24 | Exceptional 14.4% |
| Iranians | 100.0 /100 | #25 | Exceptional 14.4% |
| Spanish American Indians | 100.0 /100 | #26 | Exceptional 14.4% |
| Nepalese | 100.0 /100 | #27 | Exceptional 14.4% |
| Immigrants | South Central Asia | 100.0 /100 | #28 | Exceptional 14.5% |
| Somalis | 100.0 /100 | #29 | Exceptional 14.5% |
| Thais | 100.0 /100 | #30 | Exceptional 14.5% |
| Icelanders | 100.0 /100 | #31 | Exceptional 14.5% |
| Asians | 100.0 /100 | #32 | Exceptional 14.6% |
| Okinawans | 100.0 /100 | #33 | Exceptional 14.6% |