Asian vs Bhutanese Single Father Poverty
COMPARE
Asian
Bhutanese
Single Father Poverty
Single Father Poverty Comparison
Asians
Bhutanese
14.6%
SINGLE FATHER POVERTY
100.0/ 100
METRIC RATING
32nd/ 347
METRIC RANK
15.0%
SINGLE FATHER POVERTY
99.9/ 100
METRIC RATING
50th/ 347
METRIC RANK
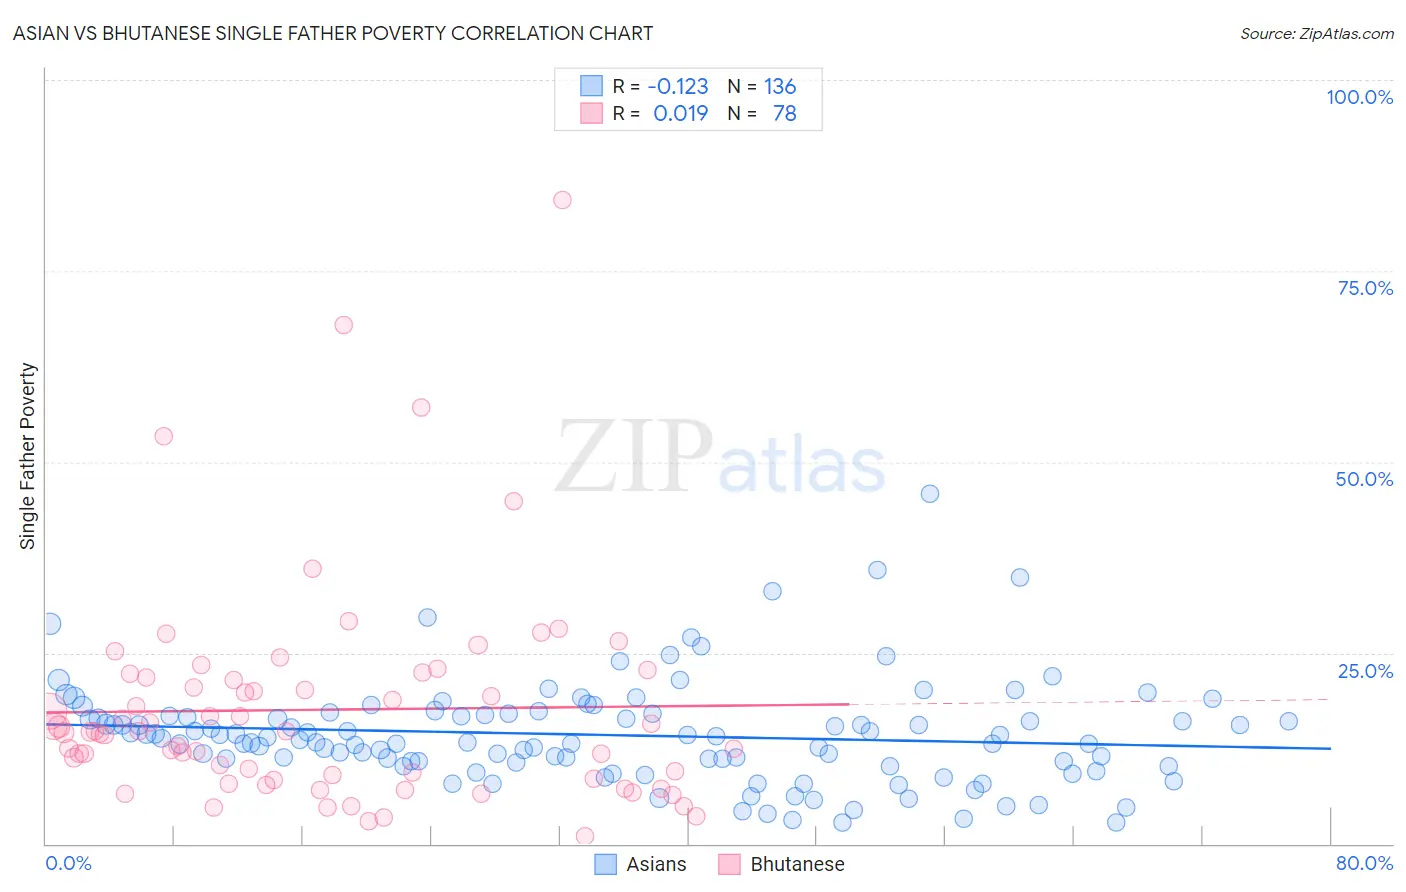
Asian vs Bhutanese Single Father Poverty Correlation Chart
The statistical analysis conducted on geographies consisting of 402,614,567 people shows a poor negative correlation between the proportion of Asians and poverty level among single fathers in the United States with a correlation coefficient (R) of -0.123 and weighted average of 14.6%. Similarly, the statistical analysis conducted on geographies consisting of 350,288,163 people shows no correlation between the proportion of Bhutanese and poverty level among single fathers in the United States with a correlation coefficient (R) of 0.019 and weighted average of 15.0%, a difference of 2.8%.
Single Father Poverty Correlation Summary
| Measurement | Asian | Bhutanese |
| Minimum | 2.7% | 0.92% |
| Maximum | 45.8% | 84.3% |
| Range | 43.1% | 83.3% |
| Mean | 14.3% | 17.6% |
| Median | 13.7% | 14.7% |
| Interquartile 25% (IQ1) | 10.7% | 8.5% |
| Interquartile 75% (IQ3) | 16.8% | 21.8% |
| Interquartile Range (IQR) | 6.1% | 13.3% |
| Standard Deviation (Sample) | 6.7% | 14.1% |
| Standard Deviation (Population) | 6.7% | 14.0% |
Demographics Similar to Asians and Bhutanese by Single Father Poverty
In terms of single father poverty, the demographic groups most similar to Asians are Icelander (14.5%, a difference of 0.15%), Okinawan (14.6%, a difference of 0.56%), Egyptian (14.7%, a difference of 0.66%), Immigrants from Bolivia (14.7%, a difference of 0.73%), and Immigrants from Indonesia (14.7%, a difference of 0.89%). Similarly, the demographic groups most similar to Bhutanese are Immigrants from Pakistan (15.0%, a difference of 0.020%), Immigrants from Eastern Asia (15.0%, a difference of 0.050%), Immigrants from China (14.9%, a difference of 0.21%), Malaysian (14.9%, a difference of 0.21%), and Immigrants from Cambodia (14.9%, a difference of 0.24%).
| Demographics | Rating | Rank | Single Father Poverty |
| Icelanders | 100.0 /100 | #31 | Exceptional 14.5% |
| Asians | 100.0 /100 | #32 | Exceptional 14.6% |
| Okinawans | 100.0 /100 | #33 | Exceptional 14.6% |
| Egyptians | 100.0 /100 | #34 | Exceptional 14.7% |
| Immigrants | Bolivia | 100.0 /100 | #35 | Exceptional 14.7% |
| Immigrants | Indonesia | 100.0 /100 | #36 | Exceptional 14.7% |
| Immigrants | Eastern Africa | 100.0 /100 | #37 | Exceptional 14.7% |
| Bolivians | 100.0 /100 | #38 | Exceptional 14.7% |
| Immigrants | Asia | 100.0 /100 | #39 | Exceptional 14.7% |
| Pima | 100.0 /100 | #40 | Exceptional 14.8% |
| Indians (Asian) | 100.0 /100 | #41 | Exceptional 14.8% |
| Immigrants | Nepal | 100.0 /100 | #42 | Exceptional 14.8% |
| Immigrants | Eritrea | 100.0 /100 | #43 | Exceptional 14.8% |
| Salvadorans | 100.0 /100 | #44 | Exceptional 14.9% |
| Immigrants | Somalia | 100.0 /100 | #45 | Exceptional 14.9% |
| Immigrants | Cambodia | 99.9 /100 | #46 | Exceptional 14.9% |
| Immigrants | China | 99.9 /100 | #47 | Exceptional 14.9% |
| Malaysians | 99.9 /100 | #48 | Exceptional 14.9% |
| Immigrants | Eastern Asia | 99.9 /100 | #49 | Exceptional 15.0% |
| Bhutanese | 99.9 /100 | #50 | Exceptional 15.0% |
| Immigrants | Pakistan | 99.9 /100 | #51 | Exceptional 15.0% |