Immigrants from Northern Africa vs Chippewa Single Father Poverty
COMPARE
Immigrants from Northern Africa
Chippewa
Single Father Poverty
Single Father Poverty Comparison
Immigrants from Northern Africa
Chippewa
15.3%
SINGLE FATHER POVERTY
99.5/ 100
METRIC RATING
79th/ 347
METRIC RANK
18.8%
SINGLE FATHER POVERTY
0.0/ 100
METRIC RATING
310th/ 347
METRIC RANK
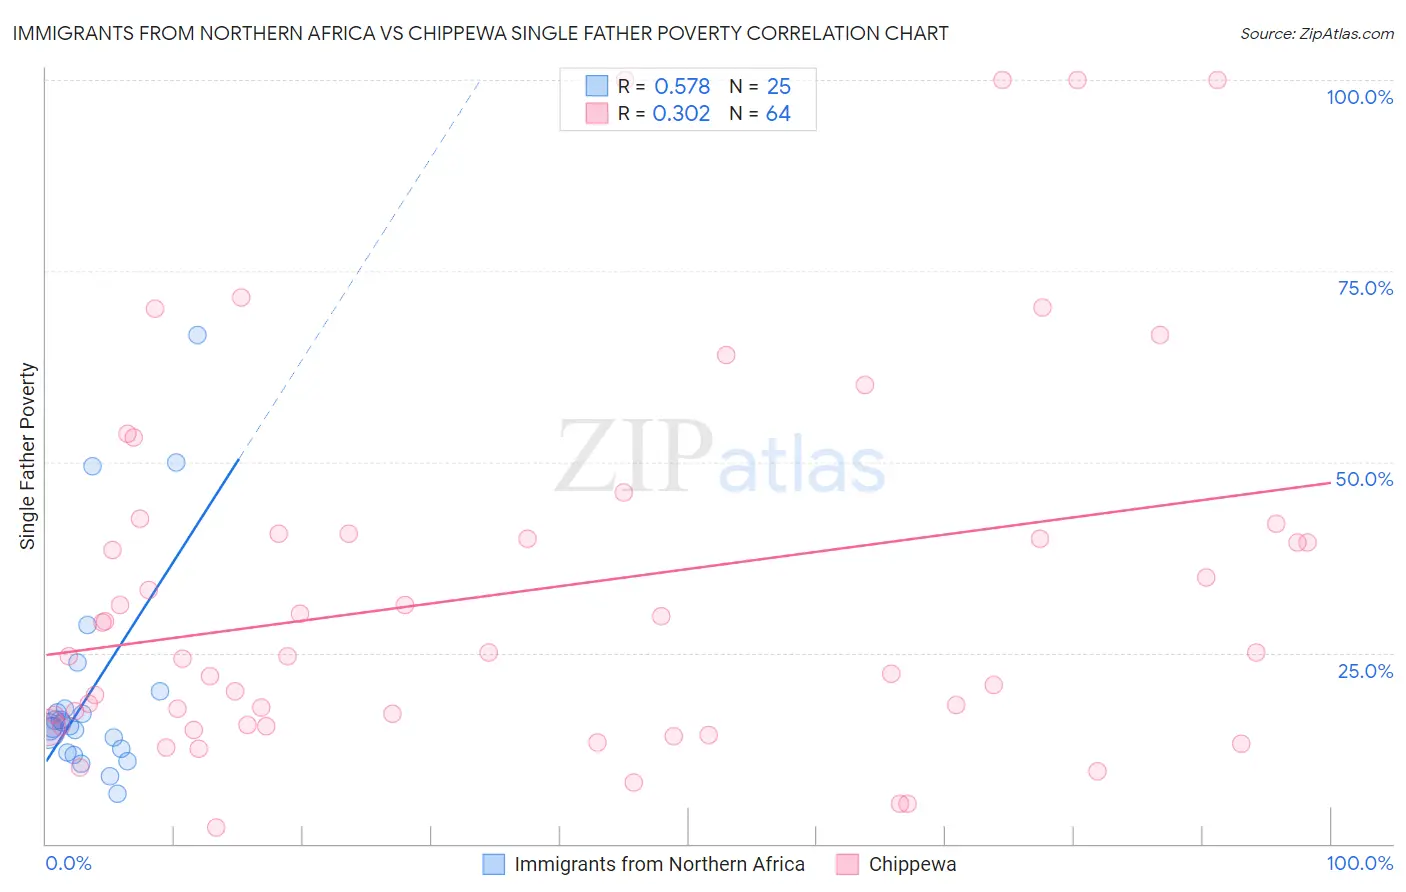
Immigrants from Northern Africa vs Chippewa Single Father Poverty Correlation Chart
The statistical analysis conducted on geographies consisting of 259,386,698 people shows a substantial positive correlation between the proportion of Immigrants from Northern Africa and poverty level among single fathers in the United States with a correlation coefficient (R) of 0.578 and weighted average of 15.3%. Similarly, the statistical analysis conducted on geographies consisting of 183,159,389 people shows a mild positive correlation between the proportion of Chippewa and poverty level among single fathers in the United States with a correlation coefficient (R) of 0.302 and weighted average of 18.8%, a difference of 22.6%.
Single Father Poverty Correlation Summary
| Measurement | Immigrants from Northern Africa | Chippewa |
| Minimum | 6.6% | 2.1% |
| Maximum | 66.7% | 100.0% |
| Range | 60.1% | 97.9% |
| Mean | 20.0% | 33.0% |
| Median | 15.3% | 24.8% |
| Interquartile 25% (IQ1) | 12.2% | 15.5% |
| Interquartile 75% (IQ3) | 18.8% | 40.6% |
| Interquartile Range (IQR) | 6.7% | 25.1% |
| Standard Deviation (Sample) | 14.3% | 24.4% |
| Standard Deviation (Population) | 14.0% | 24.2% |
Similar Demographics by Single Father Poverty
Demographics Similar to Immigrants from Northern Africa by Single Father Poverty
In terms of single father poverty, the demographic groups most similar to Immigrants from Northern Africa are Tlingit-Haida (15.3%, a difference of 0.020%), Immigrants from Peru (15.3%, a difference of 0.060%), Immigrants from Japan (15.3%, a difference of 0.080%), Immigrants from Turkey (15.3%, a difference of 0.16%), and Maltese (15.3%, a difference of 0.17%).
| Demographics | Rating | Rank | Single Father Poverty |
| Immigrants | Lithuania | 99.6 /100 | #72 | Exceptional 15.3% |
| Kenyans | 99.6 /100 | #73 | Exceptional 15.3% |
| Maltese | 99.6 /100 | #74 | Exceptional 15.3% |
| Immigrants | Turkey | 99.5 /100 | #75 | Exceptional 15.3% |
| Immigrants | Japan | 99.5 /100 | #76 | Exceptional 15.3% |
| Immigrants | Peru | 99.5 /100 | #77 | Exceptional 15.3% |
| Tlingit-Haida | 99.5 /100 | #78 | Exceptional 15.3% |
| Immigrants | Northern Africa | 99.5 /100 | #79 | Exceptional 15.3% |
| Armenians | 99.4 /100 | #80 | Exceptional 15.4% |
| Immigrants | Congo | 99.4 /100 | #81 | Exceptional 15.4% |
| Immigrants | Ukraine | 99.4 /100 | #82 | Exceptional 15.4% |
| Chinese | 99.3 /100 | #83 | Exceptional 15.4% |
| Peruvians | 99.2 /100 | #84 | Exceptional 15.4% |
| Immigrants | Oceania | 99.1 /100 | #85 | Exceptional 15.4% |
| Immigrants | Russia | 99.0 /100 | #86 | Exceptional 15.5% |
Demographics Similar to Chippewa by Single Father Poverty
In terms of single father poverty, the demographic groups most similar to Chippewa are Nonimmigrants (18.8%, a difference of 0.19%), Immigrants from Dominica (18.9%, a difference of 0.24%), Potawatomi (18.9%, a difference of 0.44%), Delaware (18.9%, a difference of 0.61%), and Chickasaw (19.0%, a difference of 0.76%).
| Demographics | Rating | Rank | Single Father Poverty |
| Celtics | 0.0 /100 | #303 | Tragic 18.5% |
| Ute | 0.0 /100 | #304 | Tragic 18.5% |
| Blackfeet | 0.0 /100 | #305 | Tragic 18.5% |
| Scotch-Irish | 0.0 /100 | #306 | Tragic 18.6% |
| French Canadians | 0.0 /100 | #307 | Tragic 18.6% |
| Ottawa | 0.0 /100 | #308 | Tragic 18.6% |
| Immigrants | Micronesia | 0.0 /100 | #309 | Tragic 18.6% |
| Chippewa | 0.0 /100 | #310 | Tragic 18.8% |
| Immigrants | Nonimmigrants | 0.0 /100 | #311 | Tragic 18.8% |
| Immigrants | Dominica | 0.0 /100 | #312 | Tragic 18.9% |
| Potawatomi | 0.0 /100 | #313 | Tragic 18.9% |
| Delaware | 0.0 /100 | #314 | Tragic 18.9% |
| Chickasaw | 0.0 /100 | #315 | Tragic 19.0% |
| Osage | 0.0 /100 | #316 | Tragic 19.0% |
| Dominicans | 0.0 /100 | #317 | Tragic 19.1% |