Asian vs Cree Single Father Poverty
COMPARE
Asian
Cree
Single Father Poverty
Single Father Poverty Comparison
Asians
Cree
14.6%
SINGLE FATHER POVERTY
100.0/ 100
METRIC RATING
32nd/ 347
METRIC RANK
17.1%
SINGLE FATHER POVERTY
1.0/ 100
METRIC RATING
253rd/ 347
METRIC RANK
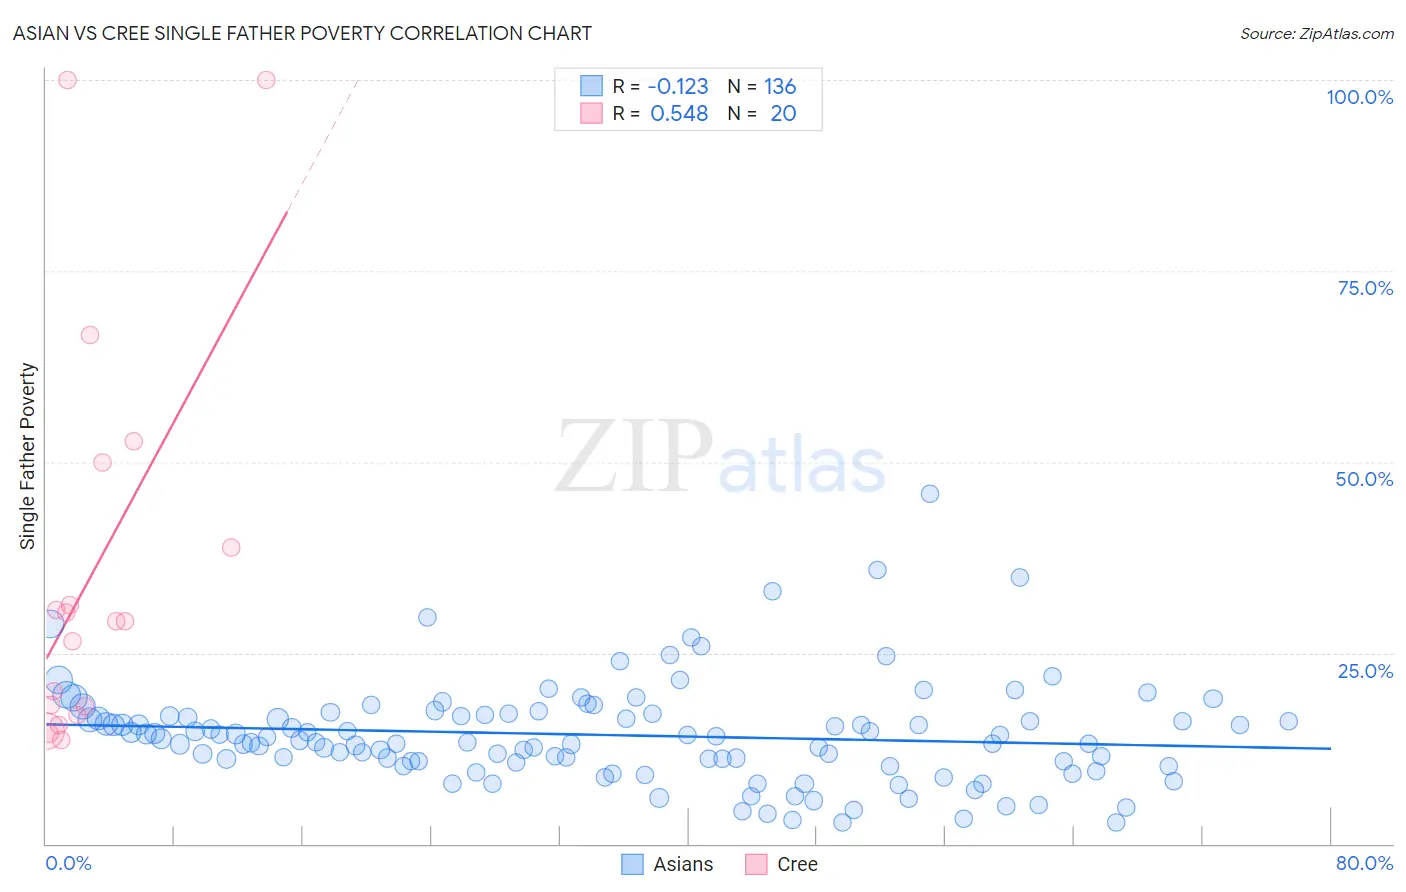
Asian vs Cree Single Father Poverty Correlation Chart
The statistical analysis conducted on geographies consisting of 402,614,567 people shows a poor negative correlation between the proportion of Asians and poverty level among single fathers in the United States with a correlation coefficient (R) of -0.123 and weighted average of 14.6%. Similarly, the statistical analysis conducted on geographies consisting of 70,905,004 people shows a substantial positive correlation between the proportion of Cree and poverty level among single fathers in the United States with a correlation coefficient (R) of 0.548 and weighted average of 17.1%, a difference of 17.6%.
Single Father Poverty Correlation Summary
| Measurement | Asian | Cree |
| Minimum | 2.7% | 13.5% |
| Maximum | 45.8% | 100.0% |
| Range | 43.1% | 86.5% |
| Mean | 14.3% | 35.8% |
| Median | 13.7% | 29.2% |
| Interquartile 25% (IQ1) | 10.7% | 17.4% |
| Interquartile 75% (IQ3) | 16.8% | 44.4% |
| Interquartile Range (IQR) | 6.1% | 26.9% |
| Standard Deviation (Sample) | 6.7% | 26.1% |
| Standard Deviation (Population) | 6.7% | 25.5% |
Similar Demographics by Single Father Poverty
Demographics Similar to Asians by Single Father Poverty
In terms of single father poverty, the demographic groups most similar to Asians are Icelander (14.5%, a difference of 0.15%), Thai (14.5%, a difference of 0.24%), Somali (14.5%, a difference of 0.28%), Immigrants from South Central Asia (14.5%, a difference of 0.38%), and Okinawan (14.6%, a difference of 0.56%).
| Demographics | Rating | Rank | Single Father Poverty |
| Iranians | 100.0 /100 | #25 | Exceptional 14.4% |
| Spanish American Indians | 100.0 /100 | #26 | Exceptional 14.4% |
| Nepalese | 100.0 /100 | #27 | Exceptional 14.4% |
| Immigrants | South Central Asia | 100.0 /100 | #28 | Exceptional 14.5% |
| Somalis | 100.0 /100 | #29 | Exceptional 14.5% |
| Thais | 100.0 /100 | #30 | Exceptional 14.5% |
| Icelanders | 100.0 /100 | #31 | Exceptional 14.5% |
| Asians | 100.0 /100 | #32 | Exceptional 14.6% |
| Okinawans | 100.0 /100 | #33 | Exceptional 14.6% |
| Egyptians | 100.0 /100 | #34 | Exceptional 14.7% |
| Immigrants | Bolivia | 100.0 /100 | #35 | Exceptional 14.7% |
| Immigrants | Indonesia | 100.0 /100 | #36 | Exceptional 14.7% |
| Immigrants | Eastern Africa | 100.0 /100 | #37 | Exceptional 14.7% |
| Bolivians | 100.0 /100 | #38 | Exceptional 14.7% |
| Immigrants | Asia | 100.0 /100 | #39 | Exceptional 14.7% |
Demographics Similar to Cree by Single Father Poverty
In terms of single father poverty, the demographic groups most similar to Cree are Croatian (17.1%, a difference of 0.010%), Austrian (17.1%, a difference of 0.11%), Luxembourger (17.1%, a difference of 0.11%), Immigrants from Honduras (17.1%, a difference of 0.12%), and Canadian (17.1%, a difference of 0.25%).
| Demographics | Rating | Rank | Single Father Poverty |
| Immigrants | Ireland | 1.4 /100 | #246 | Tragic 17.1% |
| Greeks | 1.3 /100 | #247 | Tragic 17.1% |
| Czechoslovakians | 1.3 /100 | #248 | Tragic 17.1% |
| Canadians | 1.3 /100 | #249 | Tragic 17.1% |
| Austrians | 1.1 /100 | #250 | Tragic 17.1% |
| Luxembourgers | 1.1 /100 | #251 | Tragic 17.1% |
| Croatians | 1.0 /100 | #252 | Tragic 17.1% |
| Cree | 1.0 /100 | #253 | Tragic 17.1% |
| Immigrants | Honduras | 0.9 /100 | #254 | Tragic 17.1% |
| Sierra Leoneans | 0.8 /100 | #255 | Tragic 17.2% |
| Immigrants | Haiti | 0.8 /100 | #256 | Tragic 17.2% |
| Immigrants | Albania | 0.7 /100 | #257 | Tragic 17.2% |
| Albanians | 0.7 /100 | #258 | Tragic 17.2% |
| Immigrants | Jamaica | 0.7 /100 | #259 | Tragic 17.2% |
| Spaniards | 0.6 /100 | #260 | Tragic 17.2% |