Greek vs Japanese Single Female Poverty
COMPARE
Greek
Japanese
Single Female Poverty
Single Female Poverty Comparison
Greeks
Japanese
19.4%
SINGLE FEMALE POVERTY
99.2/ 100
METRIC RATING
86th/ 347
METRIC RANK
21.3%
SINGLE FEMALE POVERTY
26.4/ 100
METRIC RATING
197th/ 347
METRIC RANK
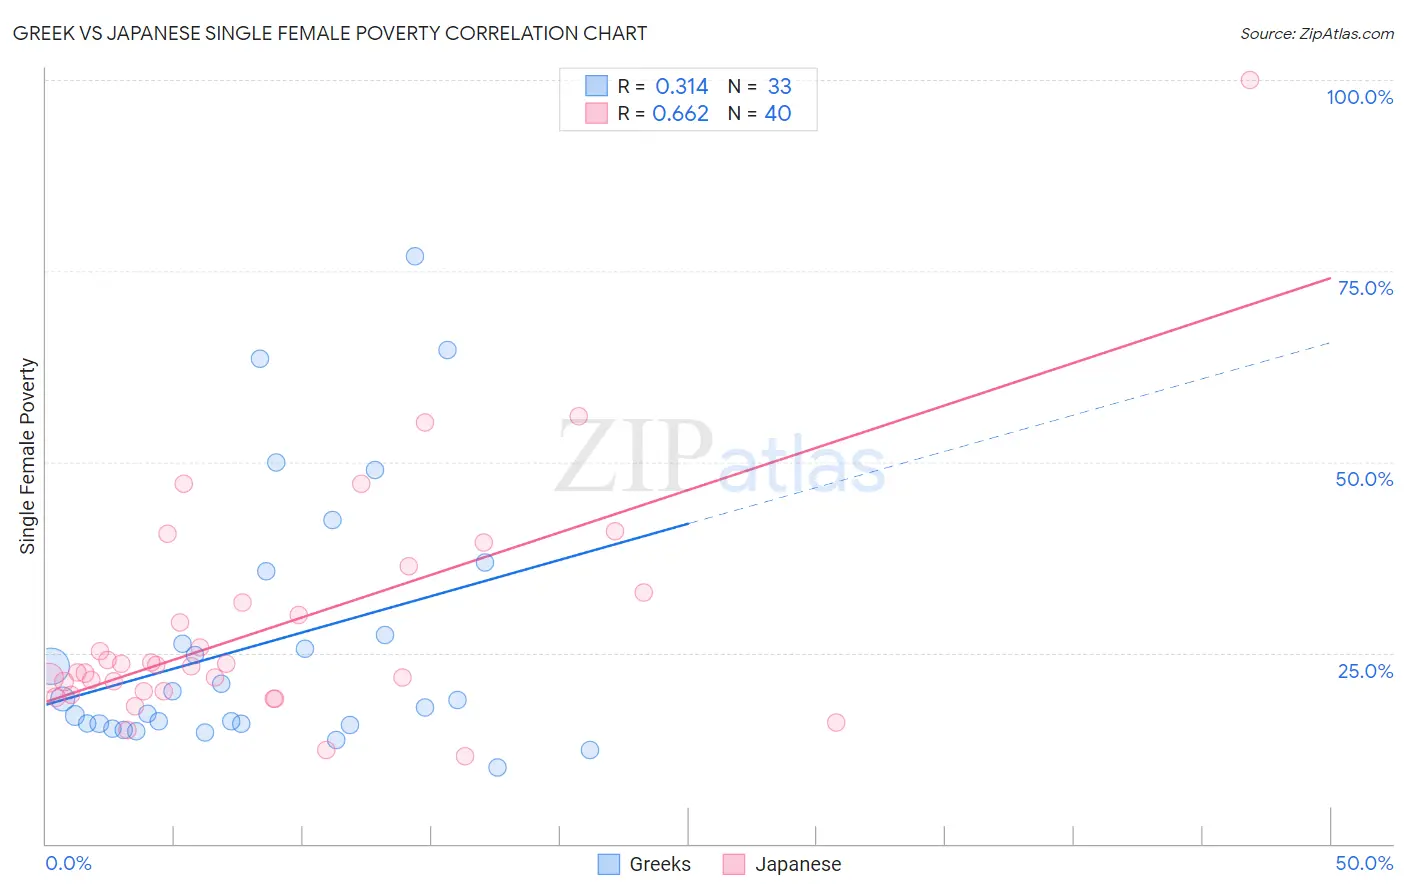
Greek vs Japanese Single Female Poverty Correlation Chart
The statistical analysis conducted on geographies consisting of 470,908,481 people shows a mild positive correlation between the proportion of Greeks and poverty level among single females in the United States with a correlation coefficient (R) of 0.314 and weighted average of 19.4%. Similarly, the statistical analysis conducted on geographies consisting of 247,508,626 people shows a significant positive correlation between the proportion of Japanese and poverty level among single females in the United States with a correlation coefficient (R) of 0.662 and weighted average of 21.3%, a difference of 9.8%.
Single Female Poverty Correlation Summary
| Measurement | Greek | Japanese |
| Minimum | 10.0% | 11.5% |
| Maximum | 76.9% | 100.0% |
| Range | 66.9% | 88.5% |
| Mean | 26.2% | 28.5% |
| Median | 18.9% | 23.4% |
| Interquartile 25% (IQ1) | 15.7% | 19.9% |
| Interquartile 75% (IQ3) | 31.5% | 32.3% |
| Interquartile Range (IQR) | 15.8% | 12.3% |
| Standard Deviation (Sample) | 17.0% | 15.9% |
| Standard Deviation (Population) | 16.7% | 15.7% |
Similar Demographics by Single Female Poverty
Demographics Similar to Greeks by Single Female Poverty
In terms of single female poverty, the demographic groups most similar to Greeks are Immigrants from Albania (19.4%, a difference of 0.0%), Immigrants from Sweden (19.4%, a difference of 0.040%), Taiwanese (19.4%, a difference of 0.12%), Immigrants from Scotland (19.4%, a difference of 0.14%), and Immigrants from Malaysia (19.4%, a difference of 0.14%).
| Demographics | Rating | Rank | Single Female Poverty |
| Immigrants | Sierra Leone | 99.3 /100 | #79 | Exceptional 19.4% |
| Immigrants | Australia | 99.3 /100 | #80 | Exceptional 19.4% |
| Immigrants | Scotland | 99.2 /100 | #81 | Exceptional 19.4% |
| Immigrants | Malaysia | 99.2 /100 | #82 | Exceptional 19.4% |
| Taiwanese | 99.2 /100 | #83 | Exceptional 19.4% |
| Immigrants | Sweden | 99.2 /100 | #84 | Exceptional 19.4% |
| Immigrants | Albania | 99.2 /100 | #85 | Exceptional 19.4% |
| Greeks | 99.2 /100 | #86 | Exceptional 19.4% |
| Zimbabweans | 99.0 /100 | #87 | Exceptional 19.5% |
| Afghans | 99.0 /100 | #88 | Exceptional 19.5% |
| Immigrants | Ukraine | 99.0 /100 | #89 | Exceptional 19.5% |
| Immigrants | Lebanon | 98.8 /100 | #90 | Exceptional 19.6% |
| Soviet Union | 98.8 /100 | #91 | Exceptional 19.6% |
| Italians | 98.8 /100 | #92 | Exceptional 19.6% |
| Immigrants | Austria | 98.8 /100 | #93 | Exceptional 19.6% |
Demographics Similar to Japanese by Single Female Poverty
In terms of single female poverty, the demographic groups most similar to Japanese are Immigrants from Saudi Arabia (21.3%, a difference of 0.060%), Nicaraguan (21.3%, a difference of 0.090%), Czechoslovakian (21.3%, a difference of 0.10%), Basque (21.3%, a difference of 0.13%), and Swiss (21.4%, a difference of 0.17%).
| Demographics | Rating | Rank | Single Female Poverty |
| Trinidadians and Tobagonians | 35.2 /100 | #190 | Fair 21.2% |
| Immigrants | Germany | 31.1 /100 | #191 | Fair 21.3% |
| Immigrants | Jamaica | 30.5 /100 | #192 | Fair 21.3% |
| Basques | 28.1 /100 | #193 | Fair 21.3% |
| Czechoslovakians | 27.7 /100 | #194 | Fair 21.3% |
| Nicaraguans | 27.6 /100 | #195 | Fair 21.3% |
| Immigrants | Saudi Arabia | 27.1 /100 | #196 | Fair 21.3% |
| Japanese | 26.4 /100 | #197 | Fair 21.3% |
| Swiss | 24.2 /100 | #198 | Fair 21.4% |
| Immigrants | Immigrants | 22.0 /100 | #199 | Fair 21.4% |
| Irish | 21.4 /100 | #200 | Fair 21.4% |
| Nigerians | 20.9 /100 | #201 | Fair 21.4% |
| Immigrants | Kenya | 20.7 /100 | #202 | Fair 21.4% |
| Immigrants | Haiti | 18.8 /100 | #203 | Poor 21.5% |
| Immigrants | Africa | 16.7 /100 | #204 | Poor 21.5% |