Croatian vs Immigrants from Central America Single Female Poverty
COMPARE
Croatian
Immigrants from Central America
Single Female Poverty
Single Female Poverty Comparison
Croatians
Immigrants from Central America
19.7%
SINGLE FEMALE POVERTY
98.1/ 100
METRIC RATING
97th/ 347
METRIC RANK
24.8%
SINGLE FEMALE POVERTY
0.0/ 100
METRIC RATING
297th/ 347
METRIC RANK
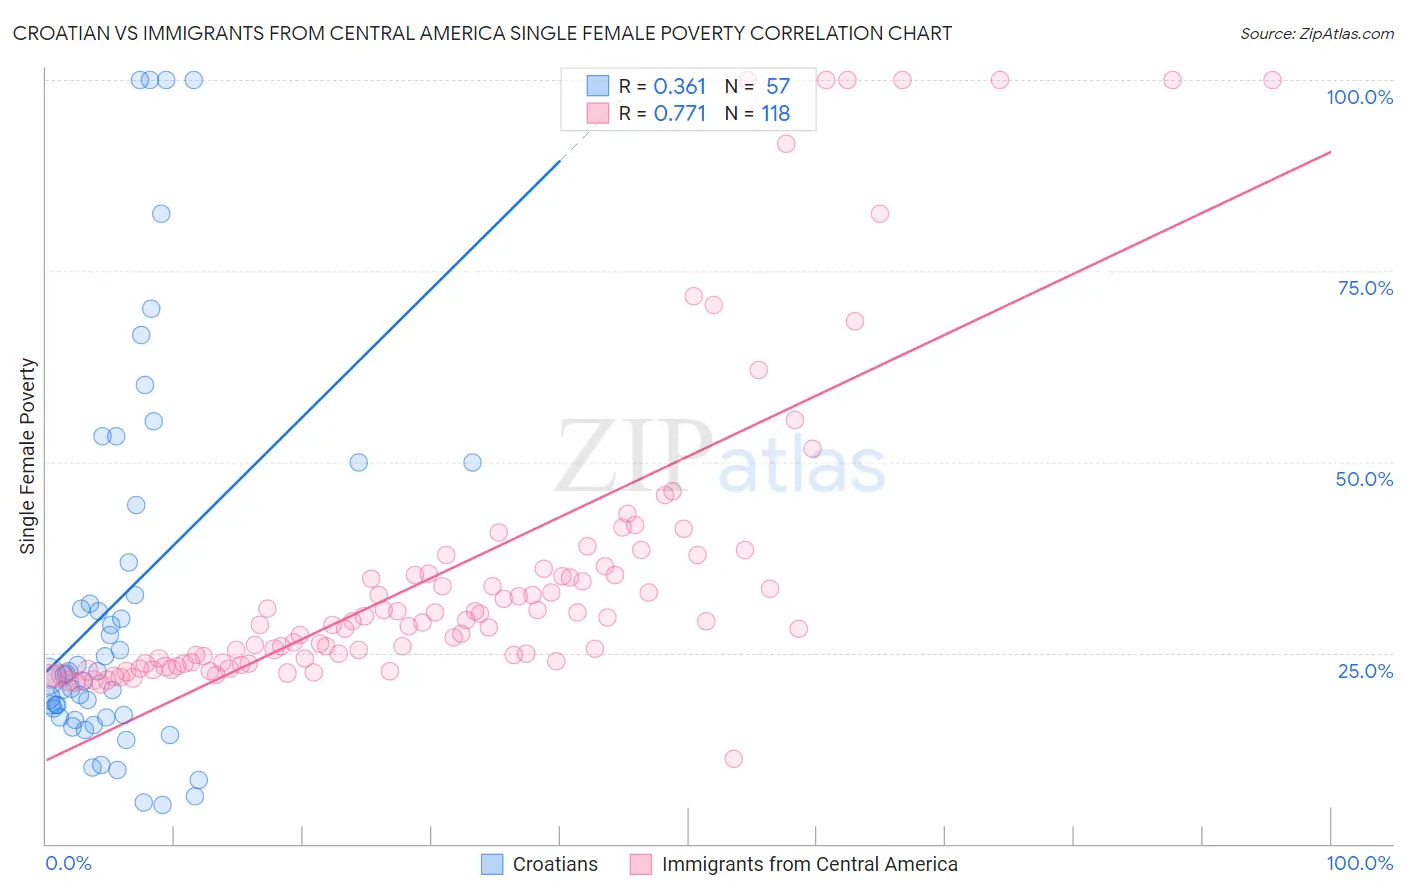
Croatian vs Immigrants from Central America Single Female Poverty Correlation Chart
The statistical analysis conducted on geographies consisting of 368,567,193 people shows a mild positive correlation between the proportion of Croatians and poverty level among single females in the United States with a correlation coefficient (R) of 0.361 and weighted average of 19.7%. Similarly, the statistical analysis conducted on geographies consisting of 523,015,170 people shows a strong positive correlation between the proportion of Immigrants from Central America and poverty level among single females in the United States with a correlation coefficient (R) of 0.771 and weighted average of 24.8%, a difference of 25.9%.
Single Female Poverty Correlation Summary
| Measurement | Croatian | Immigrants from Central America |
| Minimum | 5.0% | 11.1% |
| Maximum | 100.0% | 100.0% |
| Range | 95.0% | 88.9% |
| Mean | 32.0% | 35.5% |
| Median | 22.1% | 28.8% |
| Interquartile 25% (IQ1) | 16.5% | 23.6% |
| Interquartile 75% (IQ3) | 40.6% | 35.4% |
| Interquartile Range (IQR) | 24.0% | 11.8% |
| Standard Deviation (Sample) | 25.3% | 20.4% |
| Standard Deviation (Population) | 25.1% | 20.3% |
Similar Demographics by Single Female Poverty
Demographics Similar to Croatians by Single Female Poverty
In terms of single female poverty, the demographic groups most similar to Croatians are Immigrants from Brazil (19.7%, a difference of 0.090%), Immigrants from France (19.7%, a difference of 0.13%), Estonian (19.7%, a difference of 0.14%), Sierra Leonean (19.7%, a difference of 0.14%), and Ukrainian (19.8%, a difference of 0.39%).
| Demographics | Rating | Rank | Single Female Poverty |
| Immigrants | Lebanon | 98.8 /100 | #90 | Exceptional 19.6% |
| Soviet Union | 98.8 /100 | #91 | Exceptional 19.6% |
| Italians | 98.8 /100 | #92 | Exceptional 19.6% |
| Immigrants | Austria | 98.8 /100 | #93 | Exceptional 19.6% |
| Romanians | 98.6 /100 | #94 | Exceptional 19.6% |
| Estonians | 98.2 /100 | #95 | Exceptional 19.7% |
| Immigrants | Brazil | 98.2 /100 | #96 | Exceptional 19.7% |
| Croatians | 98.1 /100 | #97 | Exceptional 19.7% |
| Immigrants | France | 97.9 /100 | #98 | Exceptional 19.7% |
| Sierra Leoneans | 97.9 /100 | #99 | Exceptional 19.7% |
| Ukrainians | 97.6 /100 | #100 | Exceptional 19.8% |
| Immigrants | Belgium | 97.3 /100 | #101 | Exceptional 19.8% |
| Immigrants | Cameroon | 97.3 /100 | #102 | Exceptional 19.8% |
| Immigrants | Southern Europe | 97.1 /100 | #103 | Exceptional 19.9% |
| Chileans | 96.9 /100 | #104 | Exceptional 19.9% |
Demographics Similar to Immigrants from Central America by Single Female Poverty
In terms of single female poverty, the demographic groups most similar to Immigrants from Central America are Yaqui (24.9%, a difference of 0.19%), African (24.8%, a difference of 0.28%), Hispanic or Latino (24.6%, a difference of 0.76%), Mexican (25.0%, a difference of 0.86%), and Blackfeet (25.1%, a difference of 0.94%).
| Demographics | Rating | Rank | Single Female Poverty |
| Indonesians | 0.0 /100 | #290 | Tragic 24.3% |
| Osage | 0.0 /100 | #291 | Tragic 24.4% |
| Alsatians | 0.0 /100 | #292 | Tragic 24.5% |
| Americans | 0.0 /100 | #293 | Tragic 24.5% |
| French American Indians | 0.0 /100 | #294 | Tragic 24.6% |
| Hispanics or Latinos | 0.0 /100 | #295 | Tragic 24.6% |
| Africans | 0.0 /100 | #296 | Tragic 24.8% |
| Immigrants | Central America | 0.0 /100 | #297 | Tragic 24.8% |
| Yaqui | 0.0 /100 | #298 | Tragic 24.9% |
| Mexicans | 0.0 /100 | #299 | Tragic 25.0% |
| Blackfeet | 0.0 /100 | #300 | Tragic 25.1% |
| Hondurans | 0.0 /100 | #301 | Tragic 25.1% |
| Shoshone | 0.0 /100 | #302 | Tragic 25.1% |
| Somalis | 0.0 /100 | #303 | Tragic 25.2% |
| Immigrants | Congo | 0.0 /100 | #304 | Tragic 25.3% |