Arapaho vs Immigrants from Central America Median Male Earnings
COMPARE
Arapaho
Immigrants from Central America
Median Male Earnings
Median Male Earnings Comparison
Arapaho
Immigrants from Central America
$41,758
MEDIAN MALE EARNINGS
0.0/ 100
METRIC RATING
342nd/ 347
METRIC RANK
$45,538
MEDIAN MALE EARNINGS
0.0/ 100
METRIC RATING
323rd/ 347
METRIC RANK
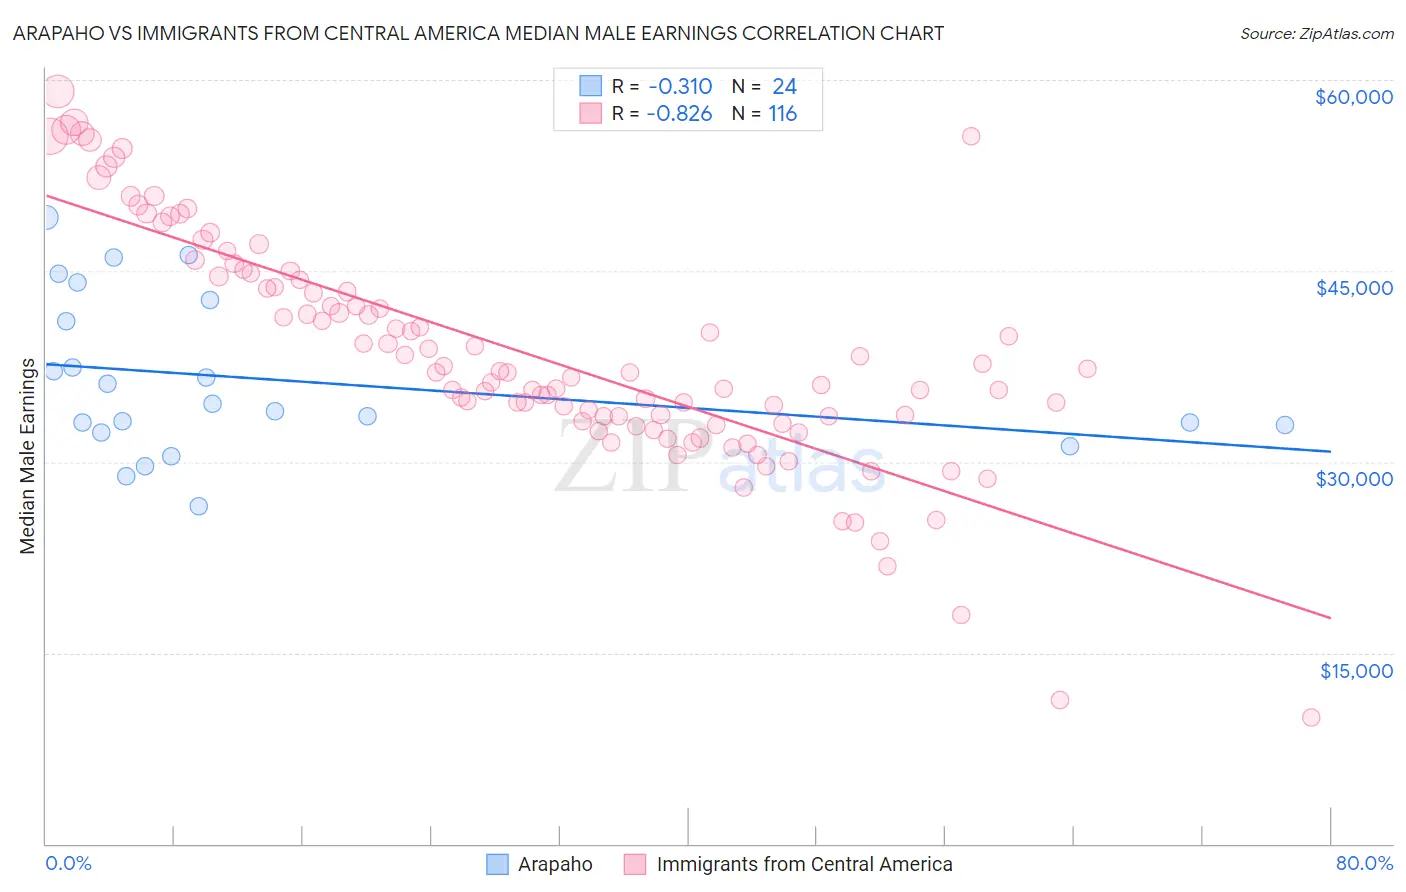
Arapaho vs Immigrants from Central America Median Male Earnings Correlation Chart
The statistical analysis conducted on geographies consisting of 29,771,934 people shows a mild negative correlation between the proportion of Arapaho and median male earnings in the United States with a correlation coefficient (R) of -0.310 and weighted average of $41,758. Similarly, the statistical analysis conducted on geographies consisting of 535,785,073 people shows a very strong negative correlation between the proportion of Immigrants from Central America and median male earnings in the United States with a correlation coefficient (R) of -0.826 and weighted average of $45,538, a difference of 9.0%.
Median Male Earnings Correlation Summary
| Measurement | Arapaho | Immigrants from Central America |
| Minimum | $26,527 | $9,917 |
| Maximum | $49,176 | $59,113 |
| Range | $22,649 | $49,196 |
| Mean | $36,456 | $38,565 |
| Median | $34,270 | $37,031 |
| Interquartile 25% (IQ1) | $32,621 | $33,411 |
| Interquartile 75% (IQ3) | $41,897 | $44,421 |
| Interquartile Range (IQR) | $9,276 | $11,009 |
| Standard Deviation (Sample) | $6,211 | $9,104 |
| Standard Deviation (Population) | $6,080 | $9,065 |
Demographics Similar to Arapaho and Immigrants from Central America by Median Male Earnings
In terms of median male earnings, the demographic groups most similar to Arapaho are Hopi ($42,060, a difference of 0.72%), Navajo ($42,098, a difference of 0.81%), Pima ($42,357, a difference of 1.4%), Crow ($42,434, a difference of 1.6%), and Menominee ($42,581, a difference of 2.0%). Similarly, the demographic groups most similar to Immigrants from Central America are Black/African American ($45,523, a difference of 0.030%), Sioux ($45,566, a difference of 0.060%), Yuman ($45,446, a difference of 0.20%), Immigrants from Haiti ($45,266, a difference of 0.60%), and Immigrants from Bahamas ($45,176, a difference of 0.80%).
| Demographics | Rating | Rank | Median Male Earnings |
| Sioux | 0.0 /100 | #322 | Tragic $45,566 |
| Immigrants | Central America | 0.0 /100 | #323 | Tragic $45,538 |
| Blacks/African Americans | 0.0 /100 | #324 | Tragic $45,523 |
| Yuman | 0.0 /100 | #325 | Tragic $45,446 |
| Immigrants | Haiti | 0.0 /100 | #326 | Tragic $45,266 |
| Immigrants | Bahamas | 0.0 /100 | #327 | Tragic $45,176 |
| Kiowa | 0.0 /100 | #328 | Tragic $45,094 |
| Yakama | 0.0 /100 | #329 | Tragic $45,002 |
| Immigrants | Mexico | 0.0 /100 | #330 | Tragic $44,960 |
| Natives/Alaskans | 0.0 /100 | #331 | Tragic $44,775 |
| Bahamians | 0.0 /100 | #332 | Tragic $44,756 |
| Immigrants | Congo | 0.0 /100 | #333 | Tragic $44,204 |
| Immigrants | Yemen | 0.0 /100 | #334 | Tragic $44,083 |
| Spanish American Indians | 0.0 /100 | #335 | Tragic $44,010 |
| Immigrants | Cuba | 0.0 /100 | #336 | Tragic $43,461 |
| Menominee | 0.0 /100 | #337 | Tragic $42,581 |
| Crow | 0.0 /100 | #338 | Tragic $42,434 |
| Pima | 0.0 /100 | #339 | Tragic $42,357 |
| Navajo | 0.0 /100 | #340 | Tragic $42,098 |
| Hopi | 0.0 /100 | #341 | Tragic $42,060 |
| Arapaho | 0.0 /100 | #342 | Tragic $41,758 |