Arapaho vs Bahamian Male Poverty
COMPARE
Arapaho
Bahamian
Male Poverty
Male Poverty Comparison
Arapaho
Bahamians
15.1%
MALE POVERTY
0.0/ 100
METRIC RATING
321st/ 347
METRIC RANK
14.1%
MALE POVERTY
0.0/ 100
METRIC RATING
303rd/ 347
METRIC RANK
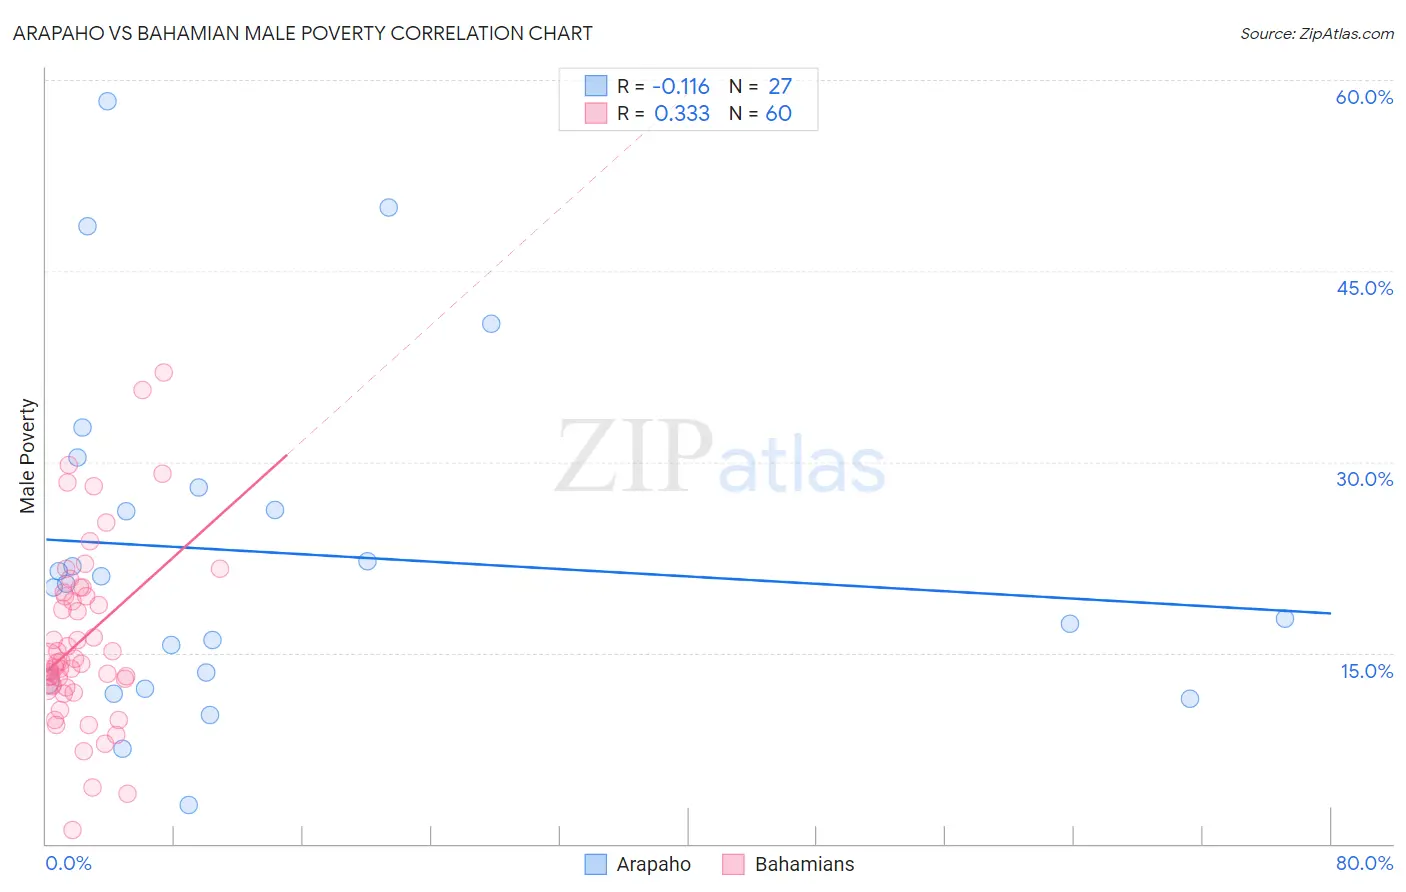
Arapaho vs Bahamian Male Poverty Correlation Chart
The statistical analysis conducted on geographies consisting of 29,777,916 people shows a poor negative correlation between the proportion of Arapaho and poverty level among males in the United States with a correlation coefficient (R) of -0.116 and weighted average of 15.1%. Similarly, the statistical analysis conducted on geographies consisting of 112,626,809 people shows a mild positive correlation between the proportion of Bahamians and poverty level among males in the United States with a correlation coefficient (R) of 0.333 and weighted average of 14.1%, a difference of 7.3%.
Male Poverty Correlation Summary
| Measurement | Arapaho | Bahamian |
| Minimum | 3.0% | 1.1% |
| Maximum | 58.3% | 37.0% |
| Range | 55.3% | 35.9% |
| Mean | 22.8% | 16.1% |
| Median | 20.4% | 14.3% |
| Interquartile 25% (IQ1) | 12.7% | 12.3% |
| Interquartile 75% (IQ3) | 28.0% | 19.6% |
| Interquartile Range (IQR) | 15.3% | 7.3% |
| Standard Deviation (Sample) | 13.5% | 7.1% |
| Standard Deviation (Population) | 13.2% | 7.0% |
Demographics Similar to Arapaho and Bahamians by Male Poverty
In terms of male poverty, the demographic groups most similar to Arapaho are Kiowa (15.2%, a difference of 0.72%), Immigrants from Congo (14.7%, a difference of 2.4%), U.S. Virgin Islander (14.7%, a difference of 2.5%), Immigrants from Grenada (14.7%, a difference of 2.5%), and Immigrants from Dominica (14.7%, a difference of 2.6%). Similarly, the demographic groups most similar to Bahamians are Immigrants from Caribbean (14.0%, a difference of 0.040%), Senegalese (14.1%, a difference of 0.10%), Immigrants from Bangladesh (14.1%, a difference of 0.32%), Creek (14.1%, a difference of 0.39%), and Dutch West Indian (14.2%, a difference of 1.1%).
| Demographics | Rating | Rank | Male Poverty |
| Immigrants | Caribbean | 0.0 /100 | #302 | Tragic 14.0% |
| Bahamians | 0.0 /100 | #303 | Tragic 14.1% |
| Senegalese | 0.0 /100 | #304 | Tragic 14.1% |
| Immigrants | Bangladesh | 0.0 /100 | #305 | Tragic 14.1% |
| Creek | 0.0 /100 | #306 | Tragic 14.1% |
| Dutch West Indians | 0.0 /100 | #307 | Tragic 14.2% |
| Africans | 0.0 /100 | #308 | Tragic 14.2% |
| Somalis | 0.0 /100 | #309 | Tragic 14.3% |
| Seminole | 0.0 /100 | #310 | Tragic 14.3% |
| Hondurans | 0.0 /100 | #311 | Tragic 14.3% |
| Choctaw | 0.0 /100 | #312 | Tragic 14.4% |
| Immigrants | Somalia | 0.0 /100 | #313 | Tragic 14.6% |
| Immigrants | Honduras | 0.0 /100 | #314 | Tragic 14.6% |
| Chippewa | 0.0 /100 | #315 | Tragic 14.6% |
| British West Indians | 0.0 /100 | #316 | Tragic 14.6% |
| Immigrants | Dominica | 0.0 /100 | #317 | Tragic 14.7% |
| Immigrants | Grenada | 0.0 /100 | #318 | Tragic 14.7% |
| U.S. Virgin Islanders | 0.0 /100 | #319 | Tragic 14.7% |
| Immigrants | Congo | 0.0 /100 | #320 | Tragic 14.7% |
| Arapaho | 0.0 /100 | #321 | Tragic 15.1% |
| Kiowa | 0.0 /100 | #322 | Tragic 15.2% |