Arapaho vs Immigrants from Iran Male Poverty
COMPARE
Arapaho
Immigrants from Iran
Male Poverty
Male Poverty Comparison
Arapaho
Immigrants from Iran
15.1%
MALE POVERTY
0.0/ 100
METRIC RATING
321st/ 347
METRIC RANK
9.9%
MALE POVERTY
99.1/ 100
METRIC RATING
42nd/ 347
METRIC RANK
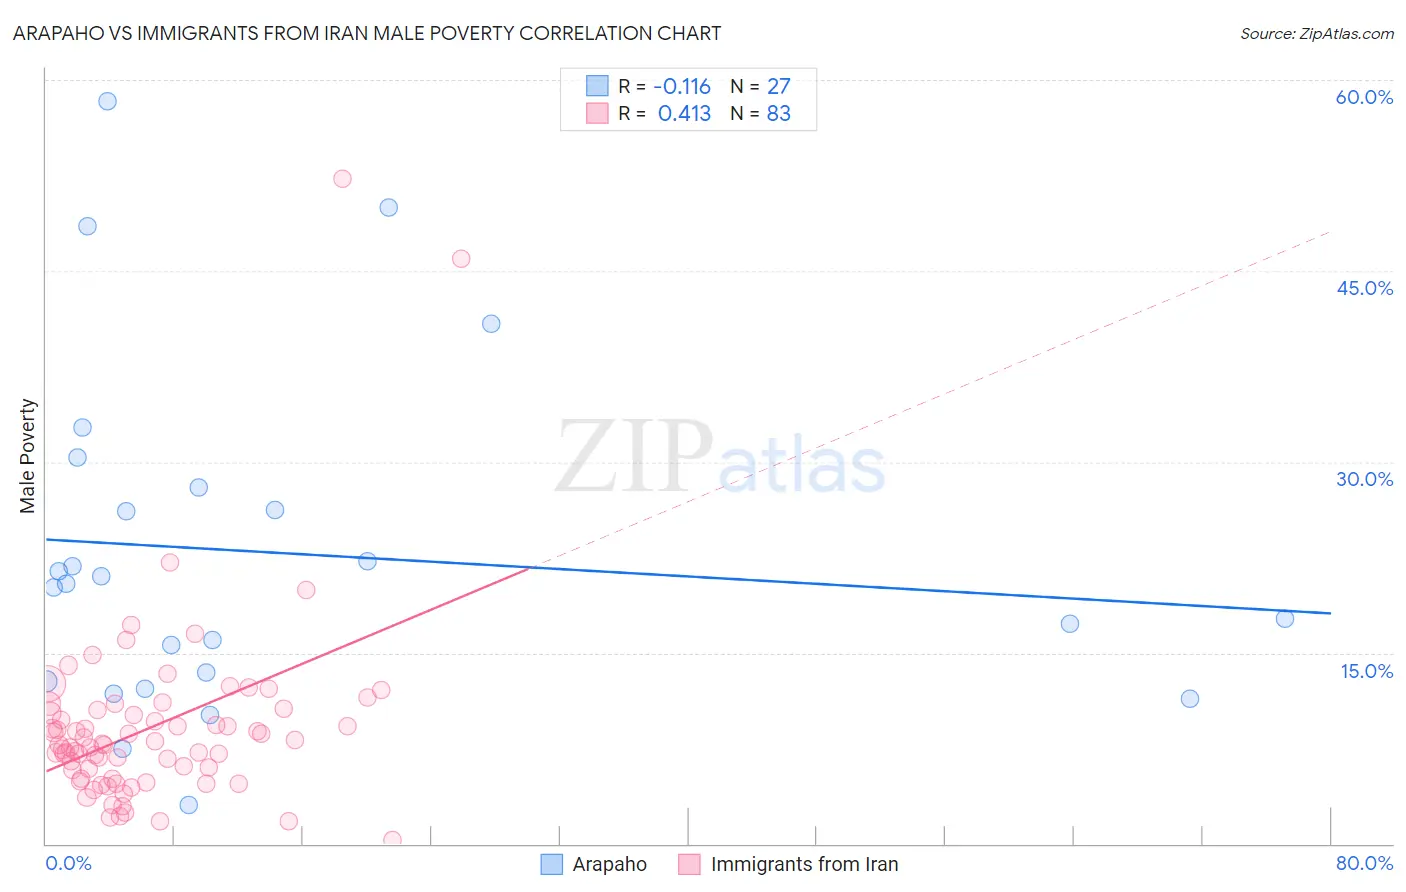
Arapaho vs Immigrants from Iran Male Poverty Correlation Chart
The statistical analysis conducted on geographies consisting of 29,777,916 people shows a poor negative correlation between the proportion of Arapaho and poverty level among males in the United States with a correlation coefficient (R) of -0.116 and weighted average of 15.1%. Similarly, the statistical analysis conducted on geographies consisting of 279,773,882 people shows a moderate positive correlation between the proportion of Immigrants from Iran and poverty level among males in the United States with a correlation coefficient (R) of 0.413 and weighted average of 9.9%, a difference of 52.3%.
Male Poverty Correlation Summary
| Measurement | Arapaho | Immigrants from Iran |
| Minimum | 3.0% | 0.33% |
| Maximum | 58.3% | 52.3% |
| Range | 55.3% | 51.9% |
| Mean | 22.8% | 9.2% |
| Median | 20.4% | 7.8% |
| Interquartile 25% (IQ1) | 12.7% | 5.1% |
| Interquartile 75% (IQ3) | 28.0% | 10.5% |
| Interquartile Range (IQR) | 15.3% | 5.4% |
| Standard Deviation (Sample) | 13.5% | 7.5% |
| Standard Deviation (Population) | 13.2% | 7.4% |
Similar Demographics by Male Poverty
Demographics Similar to Arapaho by Male Poverty
In terms of male poverty, the demographic groups most similar to Arapaho are Kiowa (15.2%, a difference of 0.72%), Colville (15.2%, a difference of 1.1%), Menominee (15.3%, a difference of 1.3%), Yakama (15.3%, a difference of 1.5%), and Central American Indian (15.3%, a difference of 1.6%).
| Demographics | Rating | Rank | Male Poverty |
| Immigrants | Honduras | 0.0 /100 | #314 | Tragic 14.6% |
| Chippewa | 0.0 /100 | #315 | Tragic 14.6% |
| British West Indians | 0.0 /100 | #316 | Tragic 14.6% |
| Immigrants | Dominica | 0.0 /100 | #317 | Tragic 14.7% |
| Immigrants | Grenada | 0.0 /100 | #318 | Tragic 14.7% |
| U.S. Virgin Islanders | 0.0 /100 | #319 | Tragic 14.7% |
| Immigrants | Congo | 0.0 /100 | #320 | Tragic 14.7% |
| Arapaho | 0.0 /100 | #321 | Tragic 15.1% |
| Kiowa | 0.0 /100 | #322 | Tragic 15.2% |
| Colville | 0.0 /100 | #323 | Tragic 15.2% |
| Menominee | 0.0 /100 | #324 | Tragic 15.3% |
| Yakama | 0.0 /100 | #325 | Tragic 15.3% |
| Central American Indians | 0.0 /100 | #326 | Tragic 15.3% |
| Paiute | 0.0 /100 | #327 | Tragic 15.8% |
| Blacks/African Americans | 0.0 /100 | #328 | Tragic 15.8% |
Demographics Similar to Immigrants from Iran by Male Poverty
In terms of male poverty, the demographic groups most similar to Immigrants from Iran are Korean (9.9%, a difference of 0.24%), Immigrants from Moldova (9.9%, a difference of 0.26%), Cypriot (9.9%, a difference of 0.34%), Immigrants from Pakistan (9.9%, a difference of 0.42%), and Russian (9.9%, a difference of 0.42%).
| Demographics | Rating | Rank | Male Poverty |
| Iranians | 99.4 /100 | #35 | Exceptional 9.8% |
| Czechs | 99.4 /100 | #36 | Exceptional 9.8% |
| Immigrants | Greece | 99.3 /100 | #37 | Exceptional 9.8% |
| Immigrants | Pakistan | 99.2 /100 | #38 | Exceptional 9.9% |
| Russians | 99.2 /100 | #39 | Exceptional 9.9% |
| Cypriots | 99.2 /100 | #40 | Exceptional 9.9% |
| Koreans | 99.2 /100 | #41 | Exceptional 9.9% |
| Immigrants | Iran | 99.1 /100 | #42 | Exceptional 9.9% |
| Immigrants | Moldova | 99.0 /100 | #43 | Exceptional 9.9% |
| Immigrants | Romania | 98.9 /100 | #44 | Exceptional 9.9% |
| Immigrants | Serbia | 98.9 /100 | #45 | Exceptional 10.0% |
| Turks | 98.9 /100 | #46 | Exceptional 10.0% |
| Immigrants | Singapore | 98.8 /100 | #47 | Exceptional 10.0% |
| Immigrants | Japan | 98.8 /100 | #48 | Exceptional 10.0% |
| Slovenes | 98.8 /100 | #49 | Exceptional 10.0% |