Arapaho vs Argentinean Male Poverty
COMPARE
Arapaho
Argentinean
Male Poverty
Male Poverty Comparison
Arapaho
Argentineans
15.1%
MALE POVERTY
0.0/ 100
METRIC RATING
321st/ 347
METRIC RANK
10.6%
MALE POVERTY
90.1/ 100
METRIC RATING
110th/ 347
METRIC RANK
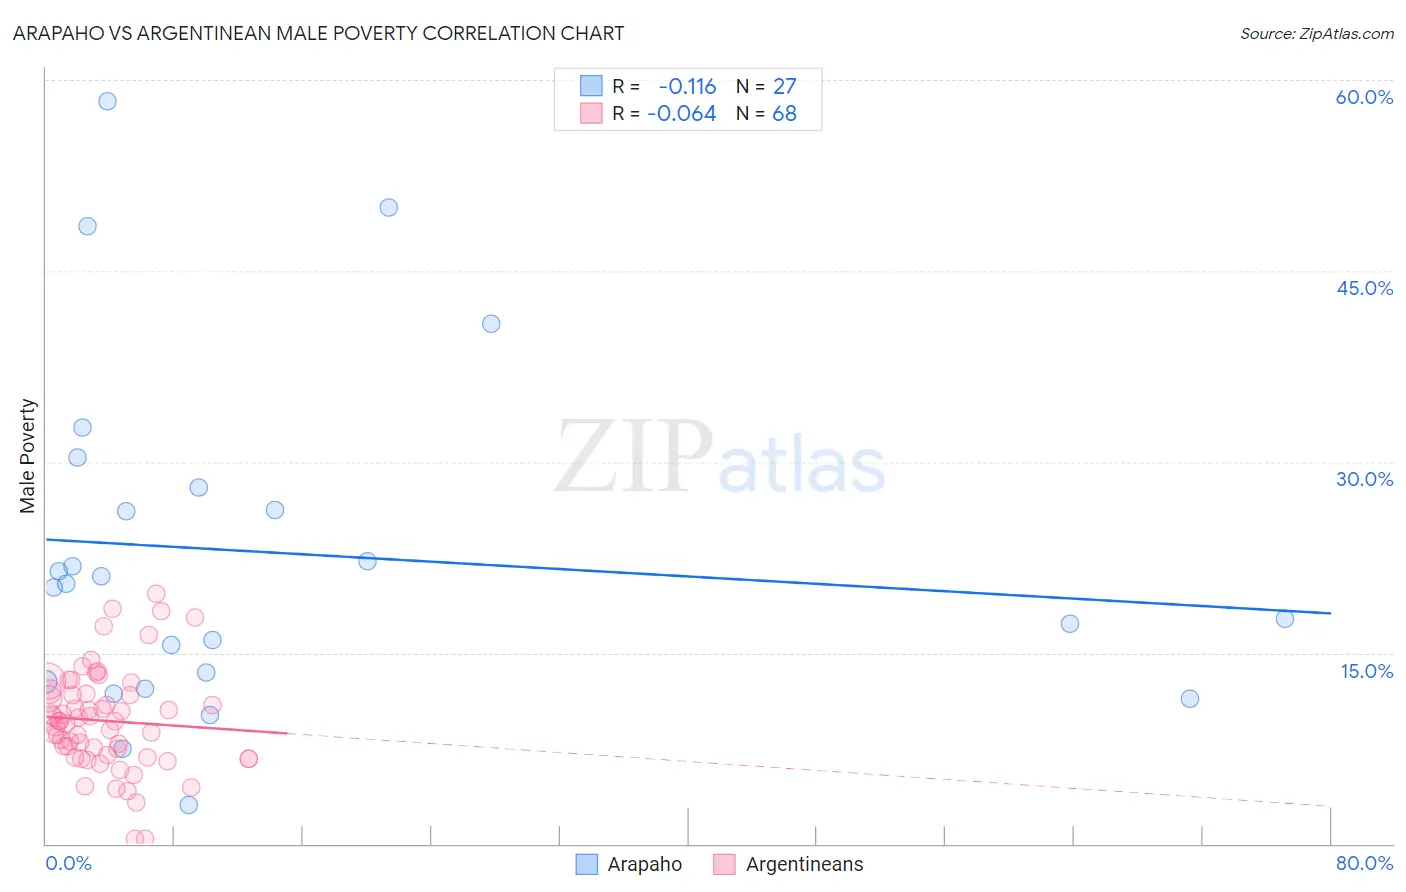
Arapaho vs Argentinean Male Poverty Correlation Chart
The statistical analysis conducted on geographies consisting of 29,777,916 people shows a poor negative correlation between the proportion of Arapaho and poverty level among males in the United States with a correlation coefficient (R) of -0.116 and weighted average of 15.1%. Similarly, the statistical analysis conducted on geographies consisting of 296,917,250 people shows a slight negative correlation between the proportion of Argentineans and poverty level among males in the United States with a correlation coefficient (R) of -0.064 and weighted average of 10.6%, a difference of 42.5%.
Male Poverty Correlation Summary
| Measurement | Arapaho | Argentinean |
| Minimum | 3.0% | 0.38% |
| Maximum | 58.3% | 19.6% |
| Range | 55.3% | 19.3% |
| Mean | 22.8% | 9.7% |
| Median | 20.4% | 9.6% |
| Interquartile 25% (IQ1) | 12.7% | 6.9% |
| Interquartile 75% (IQ3) | 28.0% | 11.7% |
| Interquartile Range (IQR) | 15.3% | 4.8% |
| Standard Deviation (Sample) | 13.5% | 3.9% |
| Standard Deviation (Population) | 13.2% | 3.9% |
Similar Demographics by Male Poverty
Demographics Similar to Arapaho by Male Poverty
In terms of male poverty, the demographic groups most similar to Arapaho are Kiowa (15.2%, a difference of 0.72%), Colville (15.2%, a difference of 1.1%), Menominee (15.3%, a difference of 1.3%), Yakama (15.3%, a difference of 1.5%), and Central American Indian (15.3%, a difference of 1.6%).
| Demographics | Rating | Rank | Male Poverty |
| Immigrants | Honduras | 0.0 /100 | #314 | Tragic 14.6% |
| Chippewa | 0.0 /100 | #315 | Tragic 14.6% |
| British West Indians | 0.0 /100 | #316 | Tragic 14.6% |
| Immigrants | Dominica | 0.0 /100 | #317 | Tragic 14.7% |
| Immigrants | Grenada | 0.0 /100 | #318 | Tragic 14.7% |
| U.S. Virgin Islanders | 0.0 /100 | #319 | Tragic 14.7% |
| Immigrants | Congo | 0.0 /100 | #320 | Tragic 14.7% |
| Arapaho | 0.0 /100 | #321 | Tragic 15.1% |
| Kiowa | 0.0 /100 | #322 | Tragic 15.2% |
| Colville | 0.0 /100 | #323 | Tragic 15.2% |
| Menominee | 0.0 /100 | #324 | Tragic 15.3% |
| Yakama | 0.0 /100 | #325 | Tragic 15.3% |
| Central American Indians | 0.0 /100 | #326 | Tragic 15.3% |
| Paiute | 0.0 /100 | #327 | Tragic 15.8% |
| Blacks/African Americans | 0.0 /100 | #328 | Tragic 15.8% |
Demographics Similar to Argentineans by Male Poverty
In terms of male poverty, the demographic groups most similar to Argentineans are Immigrants from Argentina (10.6%, a difference of 0.11%), Albanian (10.6%, a difference of 0.13%), Immigrants from Turkey (10.6%, a difference of 0.19%), Portuguese (10.6%, a difference of 0.26%), and Palestinian (10.6%, a difference of 0.29%).
| Demographics | Rating | Rank | Male Poverty |
| Slavs | 91.7 /100 | #103 | Exceptional 10.5% |
| Welsh | 91.6 /100 | #104 | Exceptional 10.5% |
| Canadians | 91.6 /100 | #105 | Exceptional 10.5% |
| Immigrants | Southern Europe | 91.3 /100 | #106 | Exceptional 10.5% |
| Laotians | 91.2 /100 | #107 | Exceptional 10.5% |
| Portuguese | 91.0 /100 | #108 | Exceptional 10.6% |
| Albanians | 90.6 /100 | #109 | Exceptional 10.6% |
| Argentineans | 90.1 /100 | #110 | Exceptional 10.6% |
| Immigrants | Argentina | 89.8 /100 | #111 | Excellent 10.6% |
| Immigrants | Turkey | 89.5 /100 | #112 | Excellent 10.6% |
| Palestinians | 89.1 /100 | #113 | Excellent 10.6% |
| Immigrants | Brazil | 89.0 /100 | #114 | Excellent 10.6% |
| Immigrants | Russia | 88.6 /100 | #115 | Excellent 10.6% |
| Sri Lankans | 88.1 /100 | #116 | Excellent 10.6% |
| Immigrants | South Eastern Asia | 88.1 /100 | #117 | Excellent 10.6% |