Arab vs Potawatomi Female Poverty
COMPARE
Arab
Potawatomi
Female Poverty
Female Poverty Comparison
Arabs
Potawatomi
13.7%
FEMALE POVERTY
28.6/ 100
METRIC RATING
197th/ 347
METRIC RANK
15.3%
FEMALE POVERTY
0.3/ 100
METRIC RATING
247th/ 347
METRIC RANK
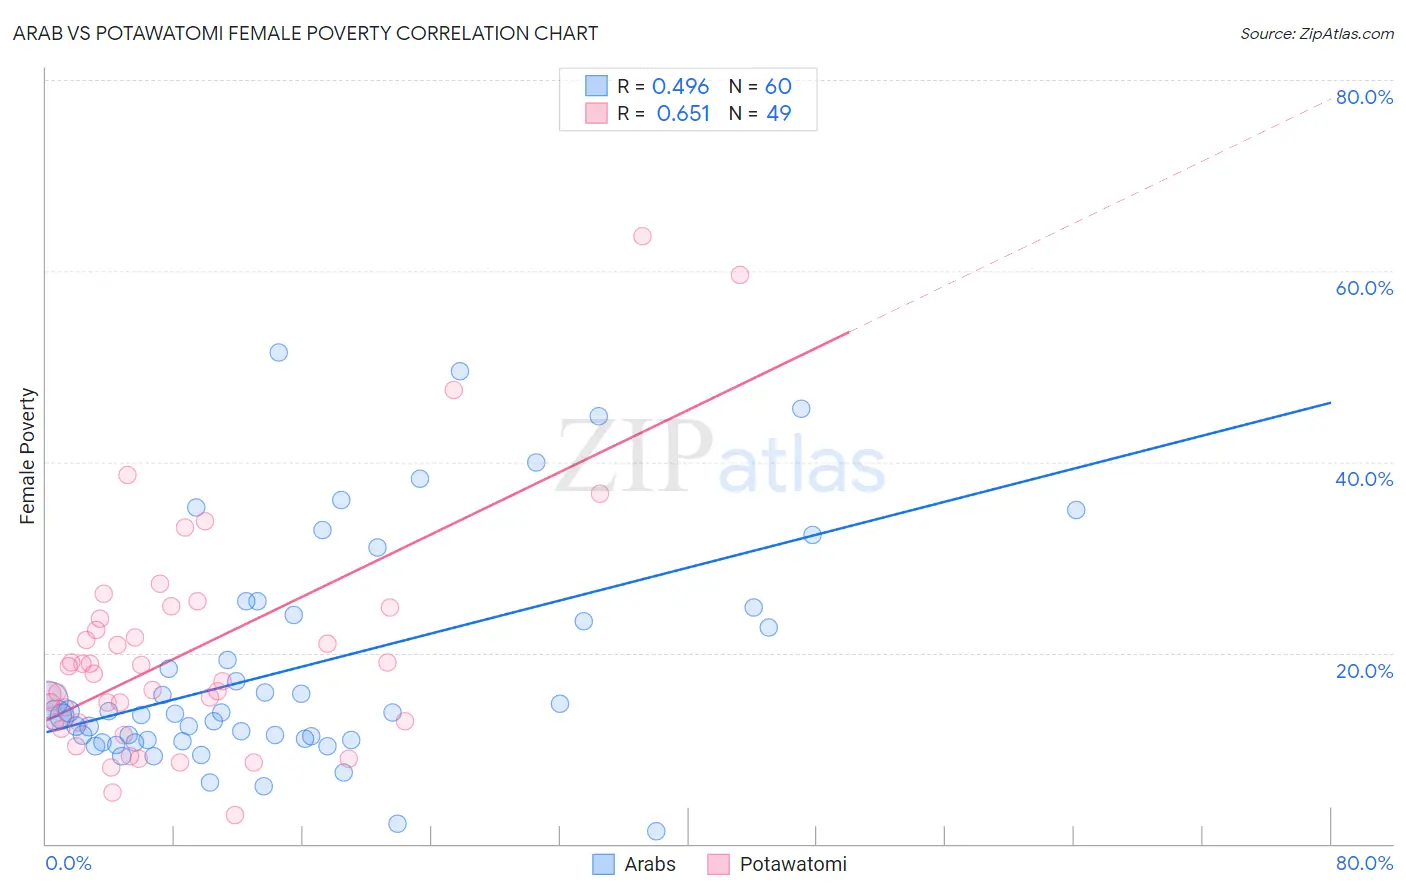
Arab vs Potawatomi Female Poverty Correlation Chart
The statistical analysis conducted on geographies consisting of 486,246,115 people shows a moderate positive correlation between the proportion of Arabs and poverty level among females in the United States with a correlation coefficient (R) of 0.496 and weighted average of 13.7%. Similarly, the statistical analysis conducted on geographies consisting of 117,742,920 people shows a significant positive correlation between the proportion of Potawatomi and poverty level among females in the United States with a correlation coefficient (R) of 0.651 and weighted average of 15.3%, a difference of 11.4%.
Female Poverty Correlation Summary
| Measurement | Arab | Potawatomi |
| Minimum | 1.3% | 3.1% |
| Maximum | 51.5% | 63.6% |
| Range | 50.2% | 60.6% |
| Mean | 18.5% | 20.2% |
| Median | 13.7% | 17.8% |
| Interquartile 25% (IQ1) | 10.8% | 12.7% |
| Interquartile 75% (IQ3) | 24.3% | 24.2% |
| Interquartile Range (IQR) | 13.5% | 11.5% |
| Standard Deviation (Sample) | 11.9% | 12.3% |
| Standard Deviation (Population) | 11.8% | 12.2% |
Similar Demographics by Female Poverty
Demographics Similar to Arabs by Female Poverty
In terms of female poverty, the demographic groups most similar to Arabs are Immigrants from Uganda (13.7%, a difference of 0.010%), South American Indian (13.7%, a difference of 0.040%), Immigrants from South America (13.7%, a difference of 0.23%), Delaware (13.7%, a difference of 0.29%), and Immigrants from Lebanon (13.8%, a difference of 0.35%).
| Demographics | Rating | Rank | Female Poverty |
| Sierra Leoneans | 33.1 /100 | #190 | Fair 13.7% |
| Immigrants | Kuwait | 32.7 /100 | #191 | Fair 13.7% |
| Immigrants | Costa Rica | 31.9 /100 | #192 | Fair 13.7% |
| Iraqis | 31.8 /100 | #193 | Fair 13.7% |
| Delaware | 31.1 /100 | #194 | Fair 13.7% |
| Immigrants | South America | 30.6 /100 | #195 | Fair 13.7% |
| South American Indians | 28.9 /100 | #196 | Fair 13.7% |
| Arabs | 28.6 /100 | #197 | Fair 13.7% |
| Immigrants | Uganda | 28.5 /100 | #198 | Fair 13.7% |
| Immigrants | Lebanon | 25.6 /100 | #199 | Fair 13.8% |
| Spanish | 21.4 /100 | #200 | Fair 13.9% |
| Immigrants | Kenya | 21.1 /100 | #201 | Fair 13.9% |
| Hmong | 21.1 /100 | #202 | Fair 13.9% |
| Immigrants | Western Asia | 20.7 /100 | #203 | Fair 13.9% |
| Spaniards | 18.9 /100 | #204 | Poor 13.9% |
Demographics Similar to Potawatomi by Female Poverty
In terms of female poverty, the demographic groups most similar to Potawatomi are Immigrants from Ghana (15.3%, a difference of 0.0%), Cuban (15.3%, a difference of 0.010%), Spanish American Indian (15.3%, a difference of 0.060%), Salvadoran (15.3%, a difference of 0.14%), and Ecuadorian (15.3%, a difference of 0.16%).
| Demographics | Rating | Rank | Female Poverty |
| Sudanese | 0.5 /100 | #240 | Tragic 15.2% |
| Immigrants | Sudan | 0.4 /100 | #241 | Tragic 15.2% |
| Nepalese | 0.4 /100 | #242 | Tragic 15.2% |
| Nicaraguans | 0.3 /100 | #243 | Tragic 15.3% |
| Ecuadorians | 0.3 /100 | #244 | Tragic 15.3% |
| Spanish American Indians | 0.3 /100 | #245 | Tragic 15.3% |
| Cubans | 0.3 /100 | #246 | Tragic 15.3% |
| Potawatomi | 0.3 /100 | #247 | Tragic 15.3% |
| Immigrants | Ghana | 0.3 /100 | #248 | Tragic 15.3% |
| Salvadorans | 0.3 /100 | #249 | Tragic 15.3% |
| Immigrants | Western Africa | 0.3 /100 | #250 | Tragic 15.3% |
| Immigrants | Trinidad and Tobago | 0.3 /100 | #251 | Tragic 15.4% |
| Immigrants | Burma/Myanmar | 0.3 /100 | #252 | Tragic 15.4% |
| Liberians | 0.2 /100 | #253 | Tragic 15.4% |
| Trinidadians and Tobagonians | 0.2 /100 | #254 | Tragic 15.4% |