Apache vs Swiss Disability Age 18 to 34
COMPARE
Apache
Swiss
Disability Age 18 to 34
Disability Age 18 to 34 Comparison
Apache
Swiss
8.4%
DISABILITY AGE 18 TO 34
0.0/ 100
METRIC RATING
333rd/ 347
METRIC RANK
7.4%
DISABILITY AGE 18 TO 34
0.1/ 100
METRIC RATING
271st/ 347
METRIC RANK
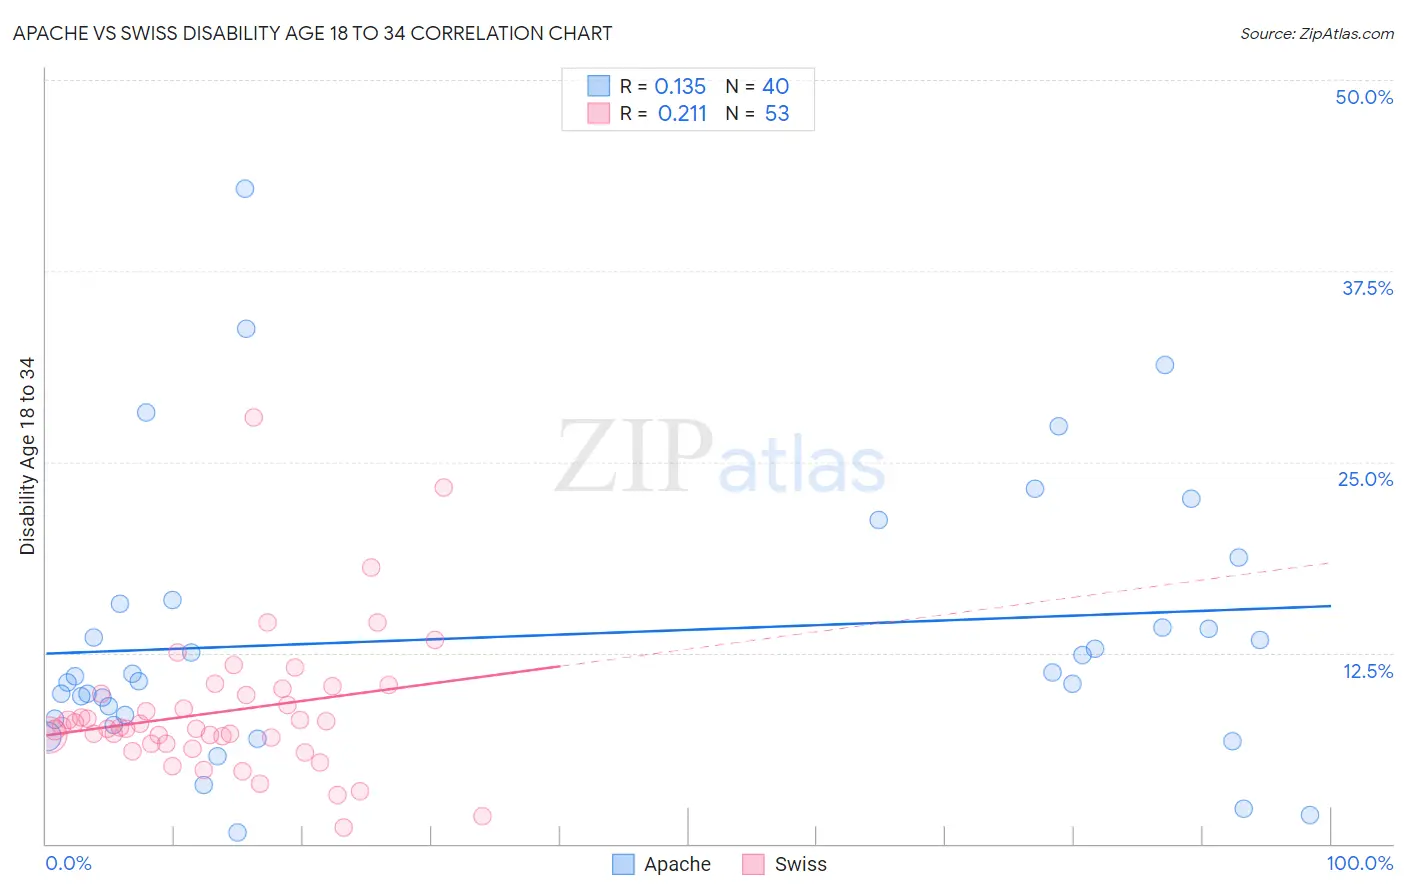
Apache vs Swiss Disability Age 18 to 34 Correlation Chart
The statistical analysis conducted on geographies consisting of 230,768,782 people shows a poor positive correlation between the proportion of Apache and percentage of population with a disability between the ages 18 and 35 in the United States with a correlation coefficient (R) of 0.135 and weighted average of 8.4%. Similarly, the statistical analysis conducted on geographies consisting of 462,694,053 people shows a weak positive correlation between the proportion of Swiss and percentage of population with a disability between the ages 18 and 35 in the United States with a correlation coefficient (R) of 0.211 and weighted average of 7.4%, a difference of 14.0%.
Disability Age 18 to 34 Correlation Summary
| Measurement | Apache | Swiss |
| Minimum | 0.77% | 1.1% |
| Maximum | 42.9% | 27.9% |
| Range | 42.1% | 26.8% |
| Mean | 13.6% | 8.7% |
| Median | 11.0% | 7.6% |
| Interquartile 25% (IQ1) | 8.3% | 6.6% |
| Interquartile 75% (IQ3) | 15.8% | 10.0% |
| Interquartile Range (IQR) | 7.6% | 3.4% |
| Standard Deviation (Sample) | 9.0% | 4.6% |
| Standard Deviation (Population) | 8.9% | 4.6% |
Similar Demographics by Disability Age 18 to 34
Demographics Similar to Apache by Disability Age 18 to 34
In terms of disability age 18 to 34, the demographic groups most similar to Apache are Dutch West Indian (8.4%, a difference of 0.21%), Seminole (8.4%, a difference of 0.33%), Puget Sound Salish (8.3%, a difference of 1.1%), Comanche (8.3%, a difference of 1.3%), and Osage (8.3%, a difference of 1.5%).
| Demographics | Rating | Rank | Disability Age 18 to 34 |
| Potawatomi | 0.0 /100 | #326 | Tragic 8.2% |
| Sioux | 0.0 /100 | #327 | Tragic 8.2% |
| Delaware | 0.0 /100 | #328 | Tragic 8.2% |
| Crow | 0.0 /100 | #329 | Tragic 8.3% |
| Osage | 0.0 /100 | #330 | Tragic 8.3% |
| Comanche | 0.0 /100 | #331 | Tragic 8.3% |
| Puget Sound Salish | 0.0 /100 | #332 | Tragic 8.3% |
| Apache | 0.0 /100 | #333 | Tragic 8.4% |
| Dutch West Indians | 0.0 /100 | #334 | Tragic 8.4% |
| Seminole | 0.0 /100 | #335 | Tragic 8.4% |
| Immigrants | Azores | 0.0 /100 | #336 | Tragic 8.5% |
| Ottawa | 0.0 /100 | #337 | Tragic 8.6% |
| Cherokee | 0.0 /100 | #338 | Tragic 8.7% |
| Kiowa | 0.0 /100 | #339 | Tragic 8.8% |
| Choctaw | 0.0 /100 | #340 | Tragic 9.0% |
Demographics Similar to Swiss by Disability Age 18 to 34
In terms of disability age 18 to 34, the demographic groups most similar to Swiss are Belgian (7.4%, a difference of 0.050%), Tsimshian (7.4%, a difference of 0.090%), Basque (7.4%, a difference of 0.14%), Slavic (7.4%, a difference of 0.14%), and African (7.4%, a difference of 0.15%).
| Demographics | Rating | Rank | Disability Age 18 to 34 |
| Bermudans | 0.1 /100 | #264 | Tragic 7.3% |
| Slovenes | 0.1 /100 | #265 | Tragic 7.3% |
| German Russians | 0.1 /100 | #266 | Tragic 7.4% |
| Bangladeshis | 0.1 /100 | #267 | Tragic 7.4% |
| Portuguese | 0.1 /100 | #268 | Tragic 7.4% |
| Basques | 0.1 /100 | #269 | Tragic 7.4% |
| Belgians | 0.1 /100 | #270 | Tragic 7.4% |
| Swiss | 0.1 /100 | #271 | Tragic 7.4% |
| Tsimshian | 0.1 /100 | #272 | Tragic 7.4% |
| Slavs | 0.1 /100 | #273 | Tragic 7.4% |
| Africans | 0.1 /100 | #274 | Tragic 7.4% |
| Immigrants | Somalia | 0.1 /100 | #275 | Tragic 7.4% |
| Europeans | 0.1 /100 | #276 | Tragic 7.4% |
| Immigrants | Portugal | 0.1 /100 | #277 | Tragic 7.4% |
| Lumbee | 0.1 /100 | #278 | Tragic 7.4% |