Apache vs Immigrants from Vietnam Seniors Poverty Over the Age of 65
COMPARE
Apache
Immigrants from Vietnam
Seniors Poverty Over the Age of 65
Seniors Poverty Over the Age of 65 Comparison
Apache
Immigrants from Vietnam
13.9%
SENIORS POVERTY OVER THE AGE OF 65
0.0/ 100
METRIC RATING
295th/ 347
METRIC RANK
11.2%
SENIORS POVERTY OVER THE AGE OF 65
26.6/ 100
METRIC RATING
195th/ 347
METRIC RANK
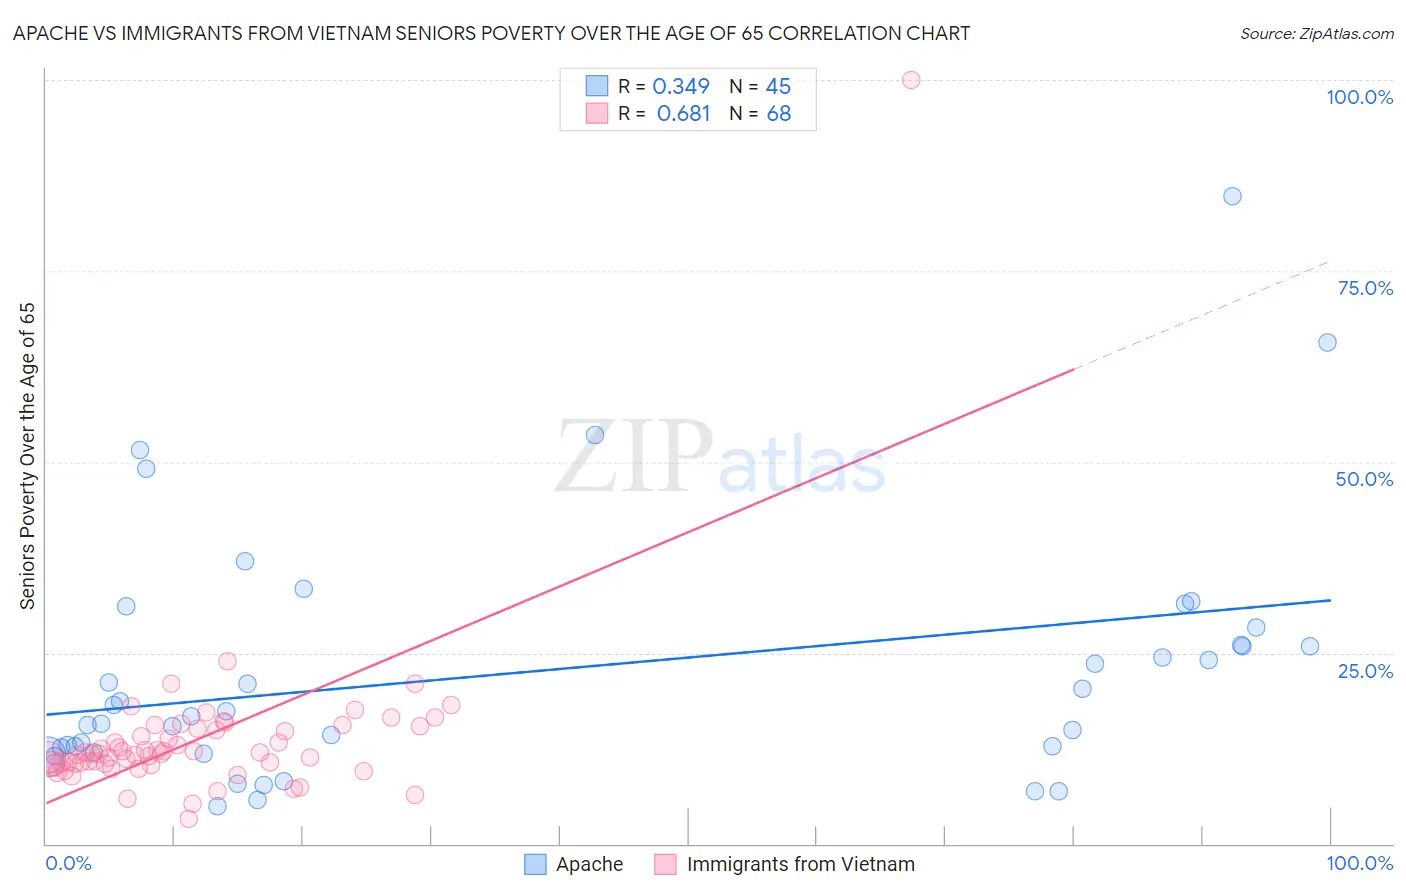
Apache vs Immigrants from Vietnam Seniors Poverty Over the Age of 65 Correlation Chart
The statistical analysis conducted on geographies consisting of 230,541,772 people shows a mild positive correlation between the proportion of Apache and poverty level among seniors over the age of 65 in the United States with a correlation coefficient (R) of 0.349 and weighted average of 13.9%. Similarly, the statistical analysis conducted on geographies consisting of 403,531,662 people shows a significant positive correlation between the proportion of Immigrants from Vietnam and poverty level among seniors over the age of 65 in the United States with a correlation coefficient (R) of 0.681 and weighted average of 11.2%, a difference of 24.4%.
Seniors Poverty Over the Age of 65 Correlation Summary
| Measurement | Apache | Immigrants from Vietnam |
| Minimum | 4.9% | 3.2% |
| Maximum | 84.8% | 100.0% |
| Range | 79.9% | 96.8% |
| Mean | 22.6% | 13.6% |
| Median | 17.3% | 11.7% |
| Interquartile 25% (IQ1) | 12.3% | 10.4% |
| Interquartile 75% (IQ3) | 27.1% | 15.0% |
| Interquartile Range (IQR) | 14.8% | 4.6% |
| Standard Deviation (Sample) | 16.5% | 11.3% |
| Standard Deviation (Population) | 16.3% | 11.2% |
Similar Demographics by Seniors Poverty Over the Age of 65
Demographics Similar to Apache by Seniors Poverty Over the Age of 65
In terms of seniors poverty over the age of 65, the demographic groups most similar to Apache are Cheyenne (13.9%, a difference of 0.19%), Immigrants from Jamaica (13.9%, a difference of 0.27%), Vietnamese (14.0%, a difference of 0.34%), Immigrants from Guatemala (13.8%, a difference of 0.61%), and Immigrants from Belize (14.0%, a difference of 0.63%).
| Demographics | Rating | Rank | Seniors Poverty Over the Age of 65 |
| Belizeans | 0.0 /100 | #288 | Tragic 13.6% |
| Jamaicans | 0.0 /100 | #289 | Tragic 13.6% |
| Immigrants | Central America | 0.0 /100 | #290 | Tragic 13.6% |
| Blacks/African Americans | 0.0 /100 | #291 | Tragic 13.7% |
| Spanish American Indians | 0.0 /100 | #292 | Tragic 13.8% |
| Immigrants | Guatemala | 0.0 /100 | #293 | Tragic 13.8% |
| Cheyenne | 0.0 /100 | #294 | Tragic 13.9% |
| Apache | 0.0 /100 | #295 | Tragic 13.9% |
| Immigrants | Jamaica | 0.0 /100 | #296 | Tragic 13.9% |
| Vietnamese | 0.0 /100 | #297 | Tragic 14.0% |
| Immigrants | Belize | 0.0 /100 | #298 | Tragic 14.0% |
| Ecuadorians | 0.0 /100 | #299 | Tragic 14.0% |
| Immigrants | Uzbekistan | 0.0 /100 | #300 | Tragic 14.0% |
| U.S. Virgin Islanders | 0.0 /100 | #301 | Tragic 14.0% |
| Yup'ik | 0.0 /100 | #302 | Tragic 14.1% |
Demographics Similar to Immigrants from Vietnam by Seniors Poverty Over the Age of 65
In terms of seniors poverty over the age of 65, the demographic groups most similar to Immigrants from Vietnam are Chilean (11.2%, a difference of 0.13%), Bangladeshi (11.2%, a difference of 0.16%), Albanian (11.2%, a difference of 0.26%), Taiwanese (11.2%, a difference of 0.29%), and Immigrants from Southern Europe (11.1%, a difference of 0.37%).
| Demographics | Rating | Rank | Seniors Poverty Over the Age of 65 |
| Immigrants | Hong Kong | 36.3 /100 | #188 | Fair 11.1% |
| Immigrants | Laos | 35.7 /100 | #189 | Fair 11.1% |
| Indians (Asian) | 34.2 /100 | #190 | Fair 11.1% |
| Immigrants | Uganda | 32.2 /100 | #191 | Fair 11.1% |
| Immigrants | Southern Europe | 30.1 /100 | #192 | Fair 11.1% |
| Taiwanese | 29.2 /100 | #193 | Fair 11.2% |
| Chileans | 27.8 /100 | #194 | Fair 11.2% |
| Immigrants | Vietnam | 26.6 /100 | #195 | Fair 11.2% |
| Bangladeshis | 25.2 /100 | #196 | Fair 11.2% |
| Albanians | 24.4 /100 | #197 | Fair 11.2% |
| Immigrants | Burma/Myanmar | 21.3 /100 | #198 | Fair 11.3% |
| Immigrants | Israel | 20.3 /100 | #199 | Fair 11.3% |
| Alsatians | 20.1 /100 | #200 | Fair 11.3% |
| Immigrants | Brazil | 17.8 /100 | #201 | Poor 11.3% |
| Costa Ricans | 17.0 /100 | #202 | Poor 11.3% |