Apache vs Alaska Native Births to Unmarried Women
COMPARE
Apache
Alaska Native
Births to Unmarried Women
Births to Unmarried Women Comparison
Apache
Alaska Natives
39.9%
BIRTHS TO UNMARRIED WOMEN
0.0/ 100
METRIC RATING
316th/ 347
METRIC RANK
38.3%
BIRTHS TO UNMARRIED WOMEN
0.0/ 100
METRIC RATING
296th/ 347
METRIC RANK
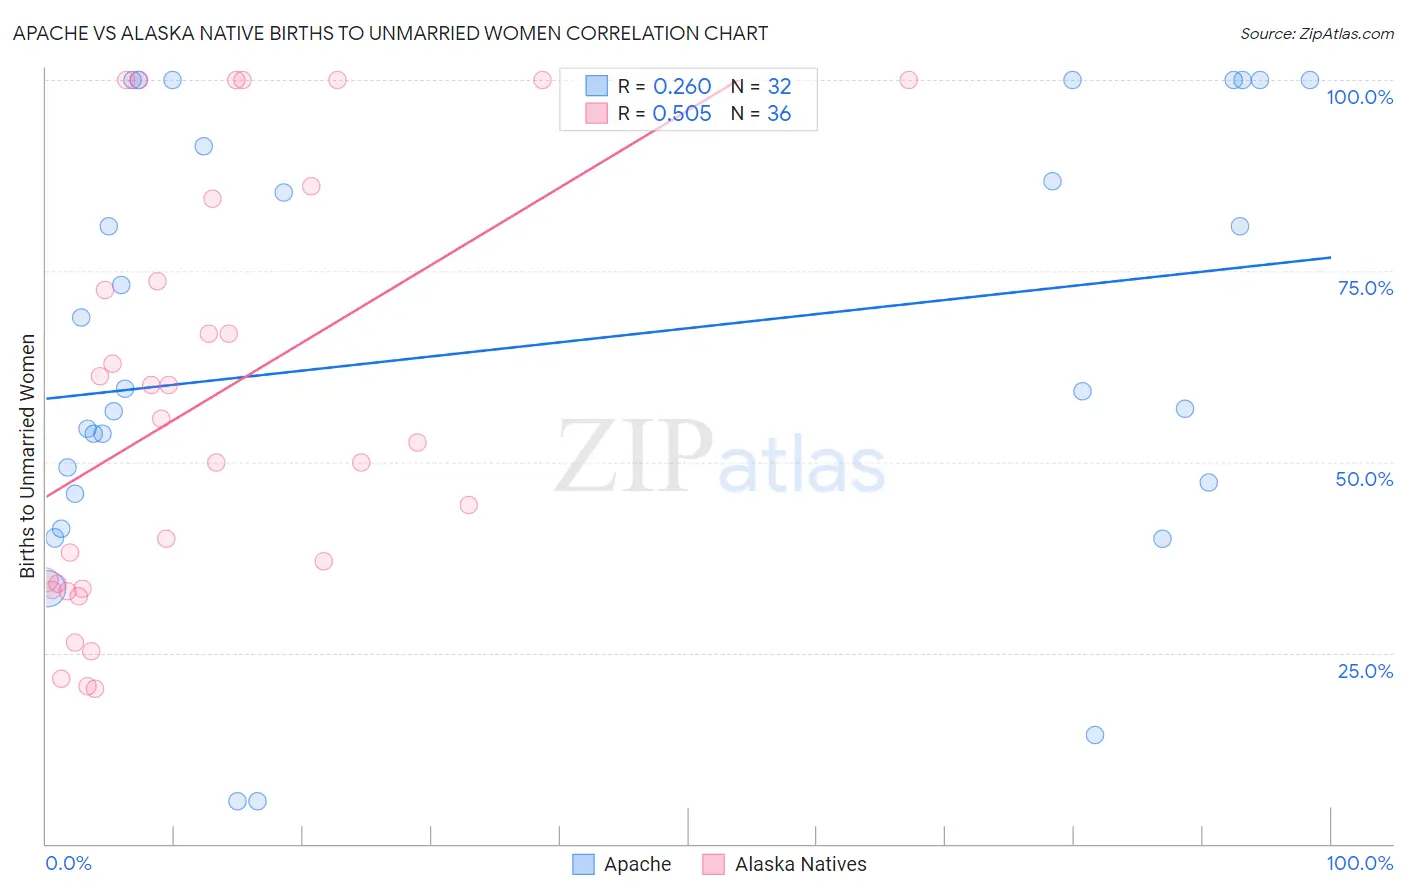
Apache vs Alaska Native Births to Unmarried Women Correlation Chart
The statistical analysis conducted on geographies consisting of 223,899,769 people shows a weak positive correlation between the proportion of Apache and percentage of births to unmarried women in the United States with a correlation coefficient (R) of 0.260 and weighted average of 39.9%. Similarly, the statistical analysis conducted on geographies consisting of 75,658,541 people shows a substantial positive correlation between the proportion of Alaska Natives and percentage of births to unmarried women in the United States with a correlation coefficient (R) of 0.505 and weighted average of 38.3%, a difference of 4.1%.
Births to Unmarried Women Correlation Summary
| Measurement | Apache | Alaska Native |
| Minimum | 5.6% | 20.3% |
| Maximum | 100.0% | 100.0% |
| Range | 94.4% | 79.7% |
| Mean | 65.1% | 57.7% |
| Median | 59.4% | 54.1% |
| Interquartile 25% (IQ1) | 46.6% | 33.8% |
| Interquartile 75% (IQ3) | 95.7% | 79.0% |
| Interquartile Range (IQR) | 49.1% | 45.3% |
| Standard Deviation (Sample) | 28.9% | 27.2% |
| Standard Deviation (Population) | 28.4% | 26.8% |
Demographics Similar to Apache and Alaska Natives by Births to Unmarried Women
In terms of births to unmarried women, the demographic groups most similar to Apache are Dominican (39.8%, a difference of 0.060%), Immigrants from Caribbean (39.8%, a difference of 0.10%), African (39.7%, a difference of 0.38%), U.S. Virgin Islander (39.6%, a difference of 0.73%), and Immigrants from the Azores (39.6%, a difference of 0.75%). Similarly, the demographic groups most similar to Alaska Natives are Dutch West Indian (38.4%, a difference of 0.28%), Jamaican (38.5%, a difference of 0.48%), Spanish American (38.6%, a difference of 0.68%), Immigrants from West Indies (38.6%, a difference of 0.74%), and Haitian (38.6%, a difference of 0.75%).
| Demographics | Rating | Rank | Births to Unmarried Women |
| Alaska Natives | 0.0 /100 | #296 | Tragic 38.3% |
| Dutch West Indians | 0.0 /100 | #297 | Tragic 38.4% |
| Jamaicans | 0.0 /100 | #298 | Tragic 38.5% |
| Spanish Americans | 0.0 /100 | #299 | Tragic 38.6% |
| Immigrants | West Indies | 0.0 /100 | #300 | Tragic 38.6% |
| Haitians | 0.0 /100 | #301 | Tragic 38.6% |
| Hondurans | 0.0 /100 | #302 | Tragic 38.7% |
| Immigrants | Jamaica | 0.0 /100 | #303 | Tragic 38.8% |
| Yaqui | 0.0 /100 | #304 | Tragic 38.8% |
| Immigrants | Haiti | 0.0 /100 | #305 | Tragic 38.9% |
| Central American Indians | 0.0 /100 | #306 | Tragic 39.0% |
| Immigrants | Honduras | 0.0 /100 | #307 | Tragic 39.3% |
| Aleuts | 0.0 /100 | #308 | Tragic 39.3% |
| Cubans | 0.0 /100 | #309 | Tragic 39.4% |
| Immigrants | Dominica | 0.0 /100 | #310 | Tragic 39.5% |
| Immigrants | Azores | 0.0 /100 | #311 | Tragic 39.6% |
| U.S. Virgin Islanders | 0.0 /100 | #312 | Tragic 39.6% |
| Africans | 0.0 /100 | #313 | Tragic 39.7% |
| Immigrants | Caribbean | 0.0 /100 | #314 | Tragic 39.8% |
| Dominicans | 0.0 /100 | #315 | Tragic 39.8% |
| Apache | 0.0 /100 | #316 | Tragic 39.9% |