American vs Immigrants from Iran Single Female Poverty
COMPARE
American
Immigrants from Iran
Single Female Poverty
Single Female Poverty Comparison
Americans
Immigrants from Iran
24.5%
SINGLE FEMALE POVERTY
0.0/ 100
METRIC RATING
293rd/ 347
METRIC RANK
17.5%
SINGLE FEMALE POVERTY
100.0/ 100
METRIC RATING
8th/ 347
METRIC RANK
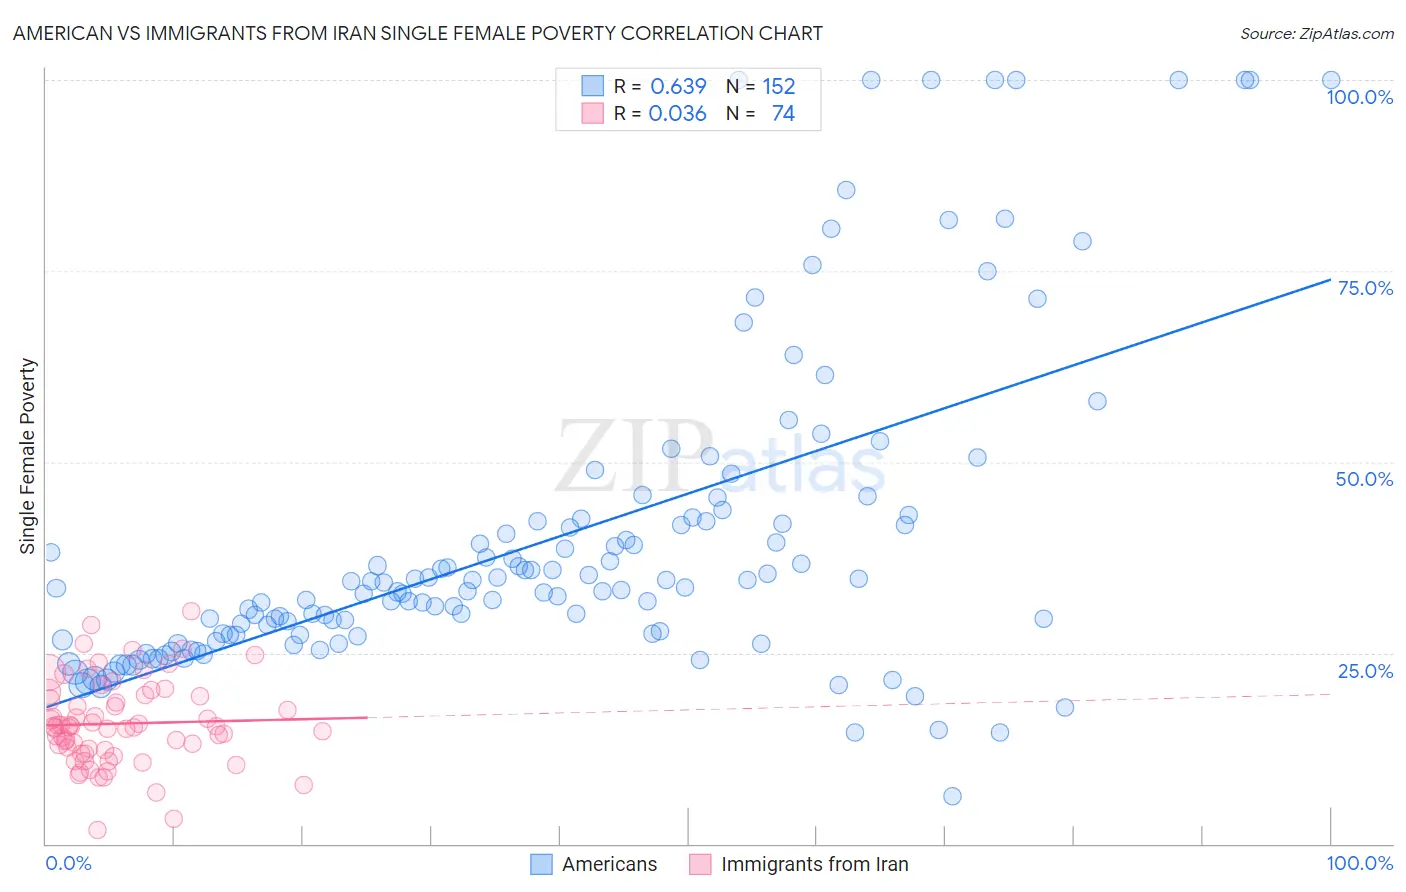
American vs Immigrants from Iran Single Female Poverty Correlation Chart
The statistical analysis conducted on geographies consisting of 559,828,526 people shows a significant positive correlation between the proportion of Americans and poverty level among single females in the United States with a correlation coefficient (R) of 0.639 and weighted average of 24.5%. Similarly, the statistical analysis conducted on geographies consisting of 276,267,918 people shows no correlation between the proportion of Immigrants from Iran and poverty level among single females in the United States with a correlation coefficient (R) of 0.036 and weighted average of 17.5%, a difference of 40.5%.
Single Female Poverty Correlation Summary
| Measurement | American | Immigrants from Iran |
| Minimum | 6.2% | 1.9% |
| Maximum | 100.0% | 30.4% |
| Range | 93.8% | 28.5% |
| Mean | 39.7% | 15.7% |
| Median | 33.3% | 15.3% |
| Interquartile 25% (IQ1) | 27.3% | 12.3% |
| Interquartile 75% (IQ3) | 42.3% | 19.3% |
| Interquartile Range (IQR) | 15.0% | 6.9% |
| Standard Deviation (Sample) | 20.8% | 5.6% |
| Standard Deviation (Population) | 20.7% | 5.5% |
Similar Demographics by Single Female Poverty
Demographics Similar to Americans by Single Female Poverty
In terms of single female poverty, the demographic groups most similar to Americans are Alsatian (24.5%, a difference of 0.080%), French American Indian (24.6%, a difference of 0.15%), Osage (24.4%, a difference of 0.44%), Hispanic or Latino (24.6%, a difference of 0.49%), and African (24.8%, a difference of 0.98%).
| Demographics | Rating | Rank | Single Female Poverty |
| Cree | 0.0 /100 | #286 | Tragic 24.1% |
| Bangladeshis | 0.0 /100 | #287 | Tragic 24.2% |
| Spanish Americans | 0.0 /100 | #288 | Tragic 24.2% |
| U.S. Virgin Islanders | 0.0 /100 | #289 | Tragic 24.2% |
| Indonesians | 0.0 /100 | #290 | Tragic 24.3% |
| Osage | 0.0 /100 | #291 | Tragic 24.4% |
| Alsatians | 0.0 /100 | #292 | Tragic 24.5% |
| Americans | 0.0 /100 | #293 | Tragic 24.5% |
| French American Indians | 0.0 /100 | #294 | Tragic 24.6% |
| Hispanics or Latinos | 0.0 /100 | #295 | Tragic 24.6% |
| Africans | 0.0 /100 | #296 | Tragic 24.8% |
| Immigrants | Central America | 0.0 /100 | #297 | Tragic 24.8% |
| Yaqui | 0.0 /100 | #298 | Tragic 24.9% |
| Mexicans | 0.0 /100 | #299 | Tragic 25.0% |
| Blackfeet | 0.0 /100 | #300 | Tragic 25.1% |
Demographics Similar to Immigrants from Iran by Single Female Poverty
In terms of single female poverty, the demographic groups most similar to Immigrants from Iran are Thai (17.3%, a difference of 0.99%), Bhutanese (17.7%, a difference of 1.4%), Immigrants from Ireland (17.8%, a difference of 1.8%), Immigrants from Lithuania (17.8%, a difference of 1.9%), and Immigrants from South Central Asia (17.8%, a difference of 2.0%).
| Demographics | Rating | Rank | Single Female Poverty |
| Chinese | 100.0 /100 | #1 | Exceptional 16.1% |
| Immigrants | Taiwan | 100.0 /100 | #2 | Exceptional 16.4% |
| Immigrants | Hong Kong | 100.0 /100 | #3 | Exceptional 16.5% |
| Immigrants | India | 100.0 /100 | #4 | Exceptional 16.8% |
| Assyrians/Chaldeans/Syriacs | 100.0 /100 | #5 | Exceptional 17.0% |
| Filipinos | 100.0 /100 | #6 | Exceptional 17.0% |
| Thais | 100.0 /100 | #7 | Exceptional 17.3% |
| Immigrants | Iran | 100.0 /100 | #8 | Exceptional 17.5% |
| Bhutanese | 100.0 /100 | #9 | Exceptional 17.7% |
| Immigrants | Ireland | 100.0 /100 | #10 | Exceptional 17.8% |
| Immigrants | Lithuania | 100.0 /100 | #11 | Exceptional 17.8% |
| Immigrants | South Central Asia | 100.0 /100 | #12 | Exceptional 17.8% |
| Immigrants | Bolivia | 100.0 /100 | #13 | Exceptional 17.8% |
| Bolivians | 100.0 /100 | #14 | Exceptional 17.9% |
| Indians (Asian) | 100.0 /100 | #15 | Exceptional 17.9% |