American vs Pakistani Single Female Poverty
COMPARE
American
Pakistani
Single Female Poverty
Single Female Poverty Comparison
Americans
Pakistanis
24.5%
SINGLE FEMALE POVERTY
0.0/ 100
METRIC RATING
293rd/ 347
METRIC RANK
20.2%
SINGLE FEMALE POVERTY
92.1/ 100
METRIC RATING
131st/ 347
METRIC RANK
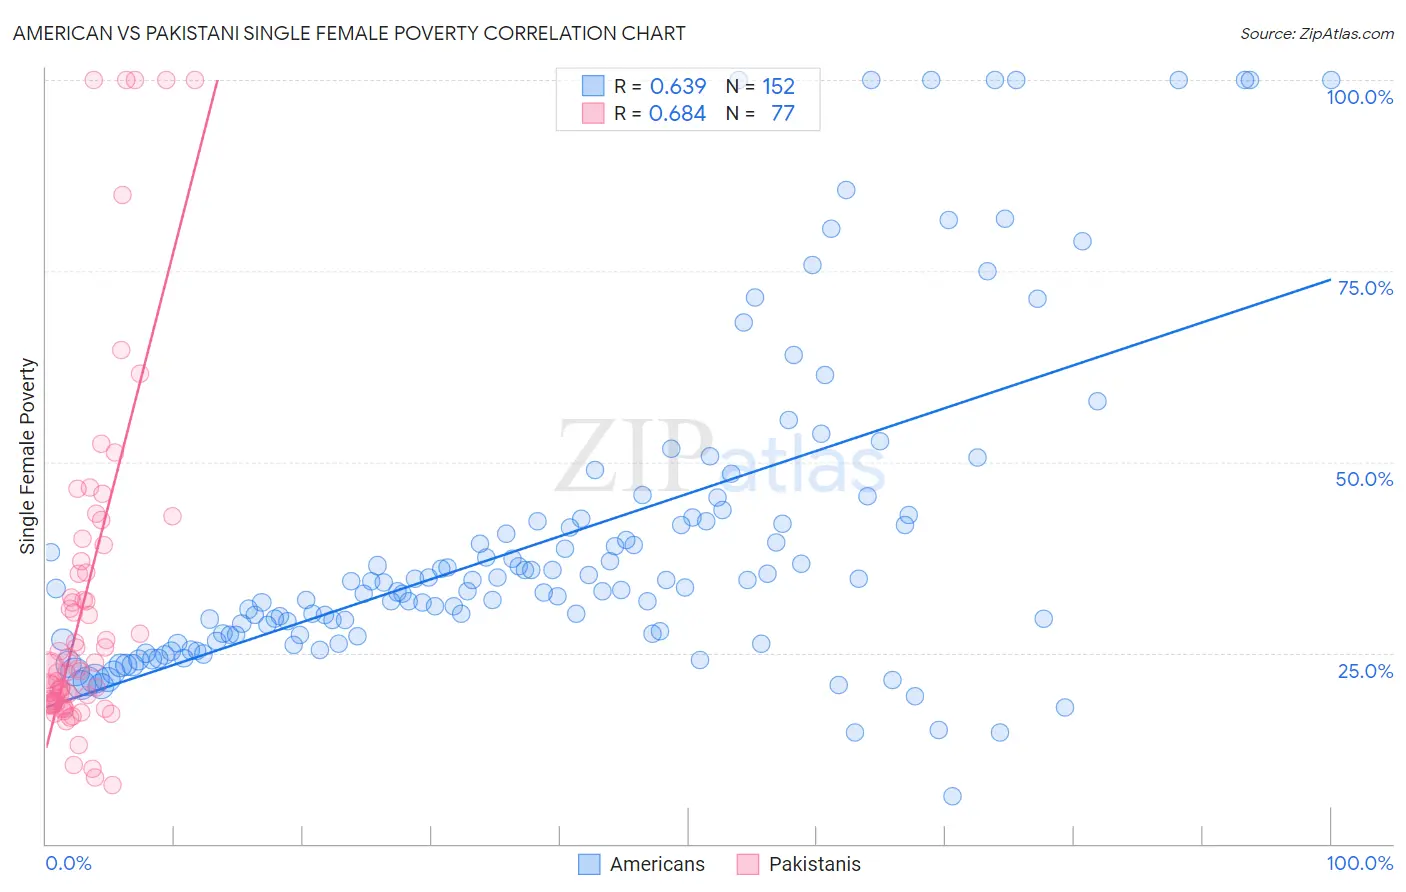
American vs Pakistani Single Female Poverty Correlation Chart
The statistical analysis conducted on geographies consisting of 559,828,526 people shows a significant positive correlation between the proportion of Americans and poverty level among single females in the United States with a correlation coefficient (R) of 0.639 and weighted average of 24.5%. Similarly, the statistical analysis conducted on geographies consisting of 331,803,446 people shows a significant positive correlation between the proportion of Pakistanis and poverty level among single females in the United States with a correlation coefficient (R) of 0.684 and weighted average of 20.2%, a difference of 21.3%.
Single Female Poverty Correlation Summary
| Measurement | American | Pakistani |
| Minimum | 6.2% | 7.7% |
| Maximum | 100.0% | 100.0% |
| Range | 93.8% | 92.3% |
| Mean | 39.7% | 31.6% |
| Median | 33.3% | 22.6% |
| Interquartile 25% (IQ1) | 27.3% | 18.4% |
| Interquartile 75% (IQ3) | 42.3% | 36.2% |
| Interquartile Range (IQR) | 15.0% | 17.8% |
| Standard Deviation (Sample) | 20.8% | 22.5% |
| Standard Deviation (Population) | 20.7% | 22.4% |
Similar Demographics by Single Female Poverty
Demographics Similar to Americans by Single Female Poverty
In terms of single female poverty, the demographic groups most similar to Americans are Alsatian (24.5%, a difference of 0.080%), French American Indian (24.6%, a difference of 0.15%), Osage (24.4%, a difference of 0.44%), Hispanic or Latino (24.6%, a difference of 0.49%), and African (24.8%, a difference of 0.98%).
| Demographics | Rating | Rank | Single Female Poverty |
| Cree | 0.0 /100 | #286 | Tragic 24.1% |
| Bangladeshis | 0.0 /100 | #287 | Tragic 24.2% |
| Spanish Americans | 0.0 /100 | #288 | Tragic 24.2% |
| U.S. Virgin Islanders | 0.0 /100 | #289 | Tragic 24.2% |
| Indonesians | 0.0 /100 | #290 | Tragic 24.3% |
| Osage | 0.0 /100 | #291 | Tragic 24.4% |
| Alsatians | 0.0 /100 | #292 | Tragic 24.5% |
| Americans | 0.0 /100 | #293 | Tragic 24.5% |
| French American Indians | 0.0 /100 | #294 | Tragic 24.6% |
| Hispanics or Latinos | 0.0 /100 | #295 | Tragic 24.6% |
| Africans | 0.0 /100 | #296 | Tragic 24.8% |
| Immigrants | Central America | 0.0 /100 | #297 | Tragic 24.8% |
| Yaqui | 0.0 /100 | #298 | Tragic 24.9% |
| Mexicans | 0.0 /100 | #299 | Tragic 25.0% |
| Blackfeet | 0.0 /100 | #300 | Tragic 25.1% |
Demographics Similar to Pakistanis by Single Female Poverty
In terms of single female poverty, the demographic groups most similar to Pakistanis are Uruguayan (20.2%, a difference of 0.0%), Immigrants from England (20.2%, a difference of 0.030%), Immigrants from Hungary (20.2%, a difference of 0.050%), Immigrants from Morocco (20.2%, a difference of 0.080%), and Immigrants from Venezuela (20.2%, a difference of 0.12%).
| Demographics | Rating | Rank | Single Female Poverty |
| Immigrants | Chile | 94.3 /100 | #124 | Exceptional 20.1% |
| Immigrants | South Africa | 93.9 /100 | #125 | Exceptional 20.1% |
| Serbians | 93.3 /100 | #126 | Exceptional 20.1% |
| Mongolians | 93.2 /100 | #127 | Exceptional 20.2% |
| Immigrants | Spain | 92.7 /100 | #128 | Exceptional 20.2% |
| Immigrants | Morocco | 92.4 /100 | #129 | Exceptional 20.2% |
| Immigrants | Hungary | 92.3 /100 | #130 | Exceptional 20.2% |
| Pakistanis | 92.1 /100 | #131 | Exceptional 20.2% |
| Uruguayans | 92.1 /100 | #132 | Exceptional 20.2% |
| Immigrants | England | 91.9 /100 | #133 | Exceptional 20.2% |
| Immigrants | Venezuela | 91.5 /100 | #134 | Exceptional 20.2% |
| Immigrants | Iraq | 91.2 /100 | #135 | Exceptional 20.2% |
| Immigrants | Canada | 91.2 /100 | #136 | Exceptional 20.2% |
| Immigrants | Nepal | 90.6 /100 | #137 | Exceptional 20.3% |
| Slovenes | 90.5 /100 | #138 | Exceptional 20.3% |