American vs Spanish American Indian Single Female Poverty
COMPARE
American
Spanish American Indian
Single Female Poverty
Single Female Poverty Comparison
Americans
Spanish American Indians
24.5%
SINGLE FEMALE POVERTY
0.0/ 100
METRIC RATING
293rd/ 347
METRIC RANK
21.1%
SINGLE FEMALE POVERTY
42.5/ 100
METRIC RATING
180th/ 347
METRIC RANK
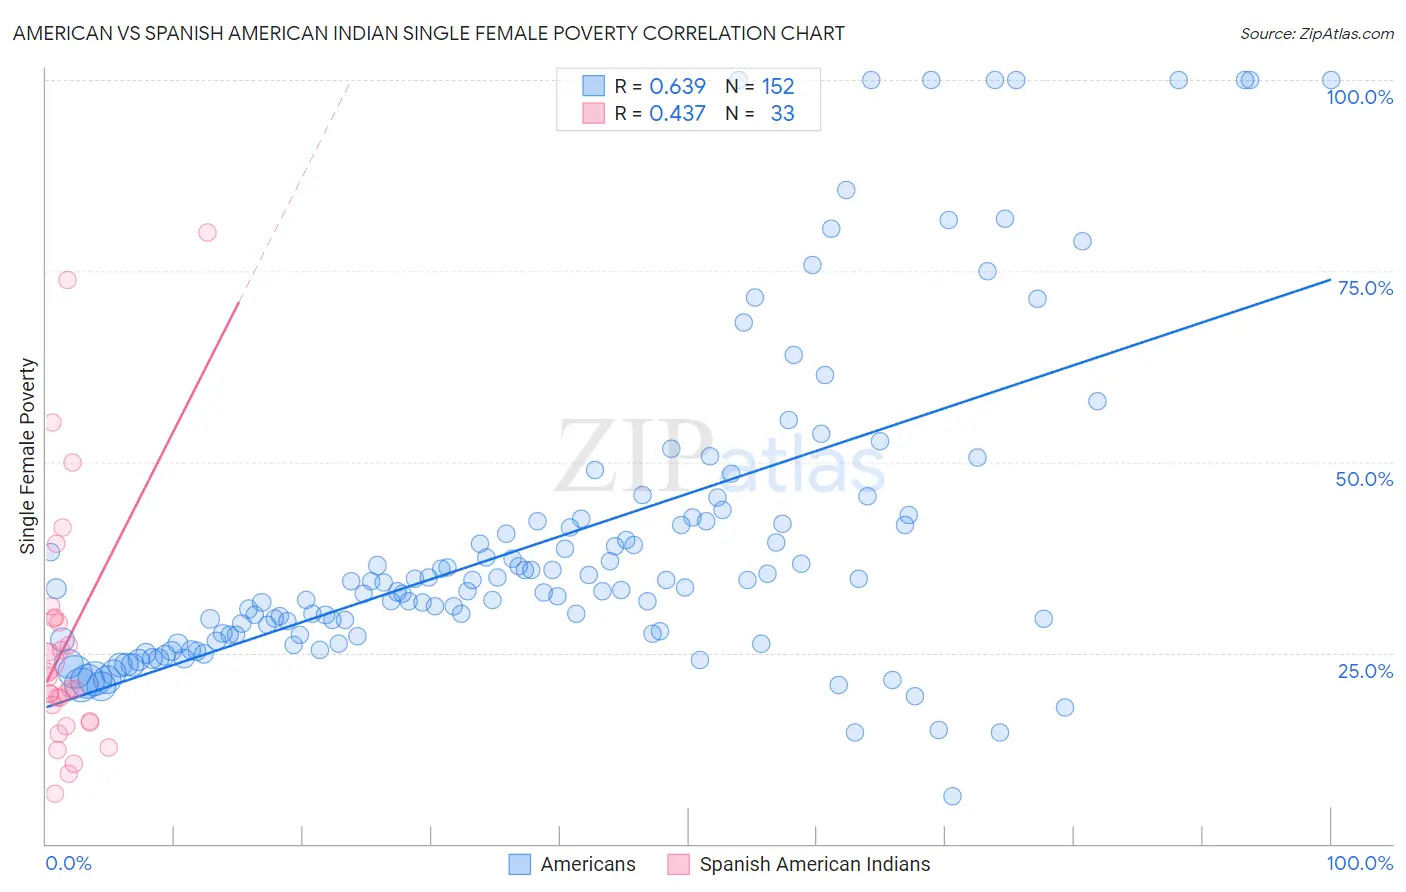
American vs Spanish American Indian Single Female Poverty Correlation Chart
The statistical analysis conducted on geographies consisting of 559,828,526 people shows a significant positive correlation between the proportion of Americans and poverty level among single females in the United States with a correlation coefficient (R) of 0.639 and weighted average of 24.5%. Similarly, the statistical analysis conducted on geographies consisting of 73,039,462 people shows a moderate positive correlation between the proportion of Spanish American Indians and poverty level among single females in the United States with a correlation coefficient (R) of 0.437 and weighted average of 21.1%, a difference of 16.1%.
Single Female Poverty Correlation Summary
| Measurement | American | Spanish American Indian |
| Minimum | 6.2% | 6.5% |
| Maximum | 100.0% | 80.0% |
| Range | 93.8% | 73.5% |
| Mean | 39.7% | 26.4% |
| Median | 33.3% | 20.4% |
| Interquartile 25% (IQ1) | 27.3% | 15.9% |
| Interquartile 75% (IQ3) | 42.3% | 29.6% |
| Interquartile Range (IQR) | 15.0% | 13.6% |
| Standard Deviation (Sample) | 20.8% | 16.9% |
| Standard Deviation (Population) | 20.7% | 16.7% |
Similar Demographics by Single Female Poverty
Demographics Similar to Americans by Single Female Poverty
In terms of single female poverty, the demographic groups most similar to Americans are Alsatian (24.5%, a difference of 0.080%), French American Indian (24.6%, a difference of 0.15%), Osage (24.4%, a difference of 0.44%), Hispanic or Latino (24.6%, a difference of 0.49%), and African (24.8%, a difference of 0.98%).
| Demographics | Rating | Rank | Single Female Poverty |
| Cree | 0.0 /100 | #286 | Tragic 24.1% |
| Bangladeshis | 0.0 /100 | #287 | Tragic 24.2% |
| Spanish Americans | 0.0 /100 | #288 | Tragic 24.2% |
| U.S. Virgin Islanders | 0.0 /100 | #289 | Tragic 24.2% |
| Indonesians | 0.0 /100 | #290 | Tragic 24.3% |
| Osage | 0.0 /100 | #291 | Tragic 24.4% |
| Alsatians | 0.0 /100 | #292 | Tragic 24.5% |
| Americans | 0.0 /100 | #293 | Tragic 24.5% |
| French American Indians | 0.0 /100 | #294 | Tragic 24.6% |
| Hispanics or Latinos | 0.0 /100 | #295 | Tragic 24.6% |
| Africans | 0.0 /100 | #296 | Tragic 24.8% |
| Immigrants | Central America | 0.0 /100 | #297 | Tragic 24.8% |
| Yaqui | 0.0 /100 | #298 | Tragic 24.9% |
| Mexicans | 0.0 /100 | #299 | Tragic 25.0% |
| Blackfeet | 0.0 /100 | #300 | Tragic 25.1% |
Demographics Similar to Spanish American Indians by Single Female Poverty
In terms of single female poverty, the demographic groups most similar to Spanish American Indians are European (21.1%, a difference of 0.010%), British (21.1%, a difference of 0.030%), Slavic (21.1%, a difference of 0.12%), Immigrants from Bosnia and Herzegovina (21.1%, a difference of 0.15%), and Scandinavian (21.1%, a difference of 0.17%).
| Demographics | Rating | Rank | Single Female Poverty |
| Immigrants | Guyana | 50.6 /100 | #173 | Average 21.0% |
| Cubans | 50.0 /100 | #174 | Average 21.0% |
| Czechs | 46.8 /100 | #175 | Average 21.0% |
| Canadians | 45.4 /100 | #176 | Average 21.1% |
| Scandinavians | 45.2 /100 | #177 | Average 21.1% |
| Immigrants | Bosnia and Herzegovina | 44.9 /100 | #178 | Average 21.1% |
| British | 42.9 /100 | #179 | Average 21.1% |
| Spanish American Indians | 42.5 /100 | #180 | Average 21.1% |
| Europeans | 42.3 /100 | #181 | Average 21.1% |
| Slavs | 40.5 /100 | #182 | Average 21.1% |
| Slovaks | 39.7 /100 | #183 | Fair 21.1% |
| Hungarians | 39.6 /100 | #184 | Fair 21.1% |
| Immigrants | Cambodia | 38.2 /100 | #185 | Fair 21.2% |
| Hawaiians | 37.7 /100 | #186 | Fair 21.2% |
| Immigrants | Nigeria | 36.8 /100 | #187 | Fair 21.2% |