Alsatian vs Palestinian Disability Age 5 to 17
COMPARE
Alsatian
Palestinian
Disability Age 5 to 17
Disability Age 5 to 17 Comparison
Alsatians
Palestinians
5.8%
DISABILITY AGE 5 TO 17
6.0/ 100
METRIC RATING
223rd/ 347
METRIC RANK
5.2%
DISABILITY AGE 5 TO 17
99.8/ 100
METRIC RATING
66th/ 347
METRIC RANK
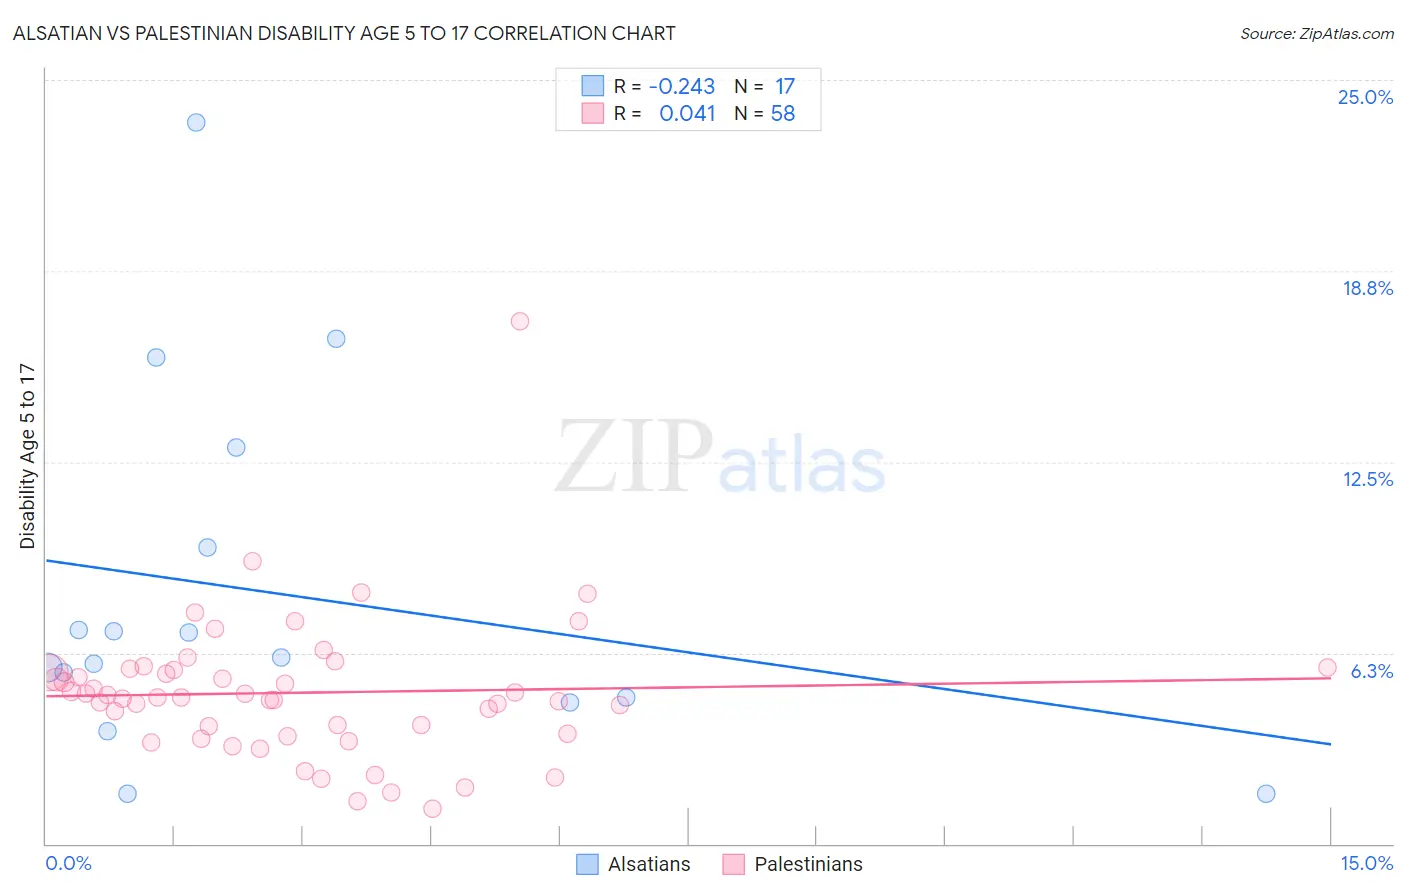
Alsatian vs Palestinian Disability Age 5 to 17 Correlation Chart
The statistical analysis conducted on geographies consisting of 82,434,825 people shows a weak negative correlation between the proportion of Alsatians and percentage of population with a disability between the ages 5 and 17 in the United States with a correlation coefficient (R) of -0.243 and weighted average of 5.8%. Similarly, the statistical analysis conducted on geographies consisting of 215,847,606 people shows no correlation between the proportion of Palestinians and percentage of population with a disability between the ages 5 and 17 in the United States with a correlation coefficient (R) of 0.041 and weighted average of 5.2%, a difference of 11.8%.
Disability Age 5 to 17 Correlation Summary
| Measurement | Alsatian | Palestinian |
| Minimum | 1.6% | 1.1% |
| Maximum | 23.6% | 17.1% |
| Range | 22.0% | 15.9% |
| Mean | 8.2% | 4.9% |
| Median | 6.1% | 4.8% |
| Interquartile 25% (IQ1) | 4.7% | 3.6% |
| Interquartile 75% (IQ3) | 11.3% | 5.7% |
| Interquartile Range (IQR) | 6.6% | 2.1% |
| Standard Deviation (Sample) | 5.9% | 2.4% |
| Standard Deviation (Population) | 5.7% | 2.3% |
Similar Demographics by Disability Age 5 to 17
Demographics Similar to Alsatians by Disability Age 5 to 17
In terms of disability age 5 to 17, the demographic groups most similar to Alsatians are Mexican (5.8%, a difference of 0.060%), Guamanian/Chamorro (5.8%, a difference of 0.080%), British West Indian (5.8%, a difference of 0.12%), Lithuanian (5.8%, a difference of 0.15%), and Immigrants from Sudan (5.8%, a difference of 0.15%).
| Demographics | Rating | Rank | Disability Age 5 to 17 |
| Nigerians | 7.5 /100 | #216 | Tragic 5.8% |
| Czechs | 7.4 /100 | #217 | Tragic 5.8% |
| Immigrants | Sierra Leone | 7.1 /100 | #218 | Tragic 5.8% |
| Sierra Leoneans | 7.0 /100 | #219 | Tragic 5.8% |
| Belgians | 6.9 /100 | #220 | Tragic 5.8% |
| Lithuanians | 6.7 /100 | #221 | Tragic 5.8% |
| Immigrants | Sudan | 6.7 /100 | #222 | Tragic 5.8% |
| Alsatians | 6.0 /100 | #223 | Tragic 5.8% |
| Mexicans | 5.7 /100 | #224 | Tragic 5.8% |
| Guamanians/Chamorros | 5.6 /100 | #225 | Tragic 5.8% |
| British West Indians | 5.4 /100 | #226 | Tragic 5.8% |
| Swiss | 5.1 /100 | #227 | Tragic 5.8% |
| Haitians | 4.8 /100 | #228 | Tragic 5.8% |
| Bangladeshis | 4.8 /100 | #229 | Tragic 5.8% |
| Ghanaians | 4.7 /100 | #230 | Tragic 5.8% |
Demographics Similar to Palestinians by Disability Age 5 to 17
In terms of disability age 5 to 17, the demographic groups most similar to Palestinians are Macedonian (5.2%, a difference of 0.030%), Immigrants from Greece (5.2%, a difference of 0.040%), Immigrants from South Eastern Asia (5.2%, a difference of 0.060%), Immigrants from Bangladesh (5.2%, a difference of 0.090%), and Immigrants from Syria (5.2%, a difference of 0.17%).
| Demographics | Rating | Rank | Disability Age 5 to 17 |
| Immigrants | North Macedonia | 99.9 /100 | #59 | Exceptional 5.1% |
| Immigrants | Eastern Europe | 99.9 /100 | #60 | Exceptional 5.1% |
| Immigrants | Switzerland | 99.8 /100 | #61 | Exceptional 5.2% |
| Immigrants | Ireland | 99.8 /100 | #62 | Exceptional 5.2% |
| Immigrants | Bangladesh | 99.8 /100 | #63 | Exceptional 5.2% |
| Immigrants | South Eastern Asia | 99.8 /100 | #64 | Exceptional 5.2% |
| Immigrants | Greece | 99.8 /100 | #65 | Exceptional 5.2% |
| Palestinians | 99.8 /100 | #66 | Exceptional 5.2% |
| Macedonians | 99.8 /100 | #67 | Exceptional 5.2% |
| Immigrants | Syria | 99.7 /100 | #68 | Exceptional 5.2% |
| Guyanese | 99.7 /100 | #69 | Exceptional 5.2% |
| Immigrants | Belgium | 99.7 /100 | #70 | Exceptional 5.2% |
| Jordanians | 99.7 /100 | #71 | Exceptional 5.2% |
| Immigrants | Vietnam | 99.7 /100 | #72 | Exceptional 5.2% |
| Immigrants | Czechoslovakia | 99.7 /100 | #73 | Exceptional 5.2% |