Alsatian vs Immigrants from the Azores Single Female Poverty
COMPARE
Alsatian
Immigrants from the Azores
Single Female Poverty
Single Female Poverty Comparison
Alsatians
Immigrants from the Azores
24.5%
SINGLE FEMALE POVERTY
0.0/ 100
METRIC RATING
292nd/ 347
METRIC RANK
23.5%
SINGLE FEMALE POVERTY
0.0/ 100
METRIC RATING
276th/ 347
METRIC RANK
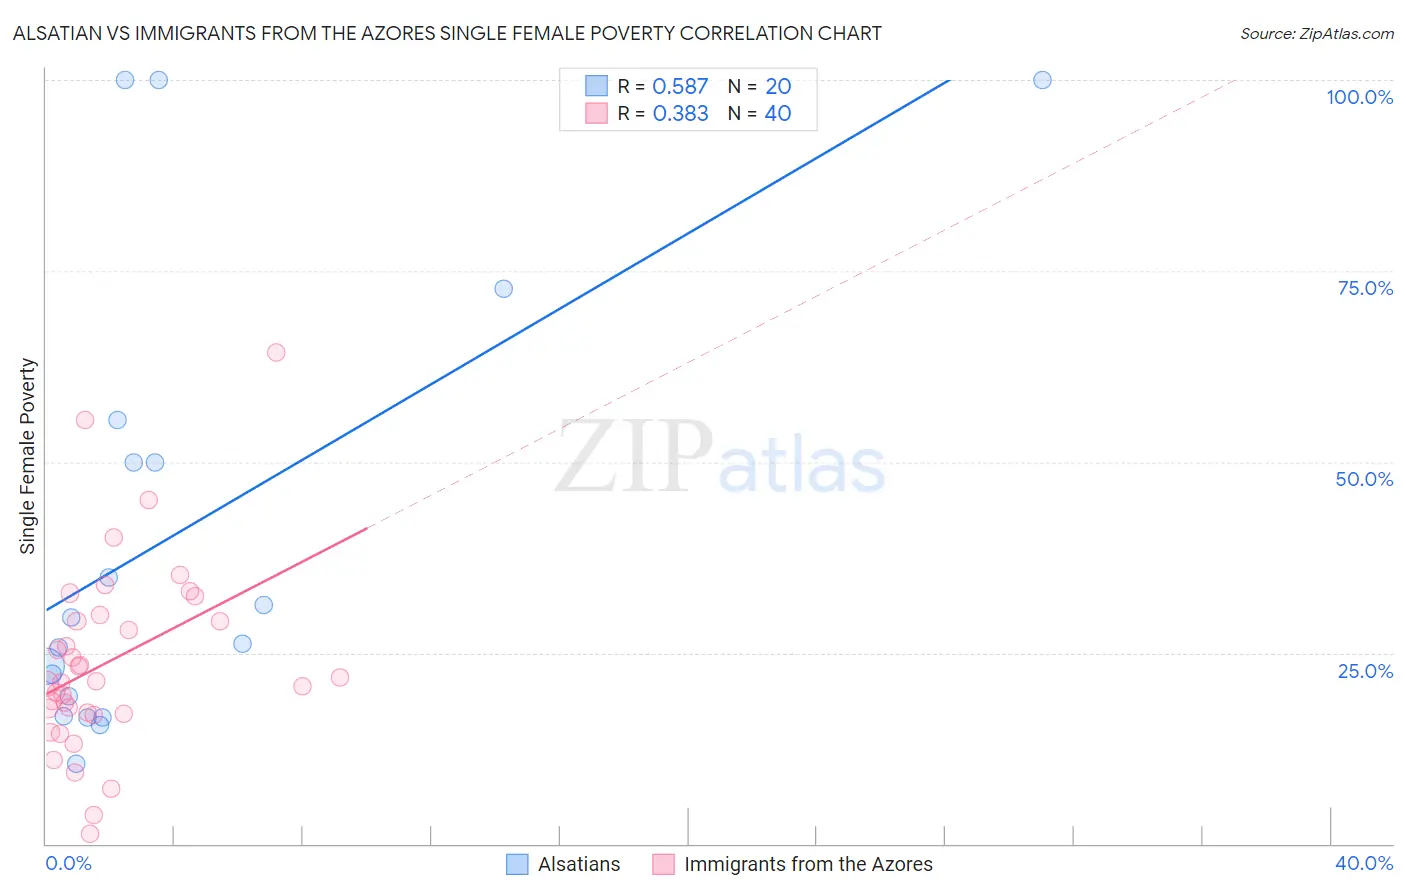
Alsatian vs Immigrants from the Azores Single Female Poverty Correlation Chart
The statistical analysis conducted on geographies consisting of 82,305,024 people shows a substantial positive correlation between the proportion of Alsatians and poverty level among single females in the United States with a correlation coefficient (R) of 0.587 and weighted average of 24.5%. Similarly, the statistical analysis conducted on geographies consisting of 45,979,056 people shows a mild positive correlation between the proportion of Immigrants from the Azores and poverty level among single females in the United States with a correlation coefficient (R) of 0.383 and weighted average of 23.5%, a difference of 4.1%.
Single Female Poverty Correlation Summary
| Measurement | Alsatian | Immigrants from the Azores |
| Minimum | 10.5% | 1.2% |
| Maximum | 100.0% | 64.3% |
| Range | 89.5% | 63.0% |
| Mean | 40.8% | 23.9% |
| Median | 27.9% | 21.2% |
| Interquartile 25% (IQ1) | 18.1% | 17.1% |
| Interquartile 75% (IQ3) | 52.7% | 29.6% |
| Interquartile Range (IQR) | 34.6% | 12.5% |
| Standard Deviation (Sample) | 30.0% | 12.5% |
| Standard Deviation (Population) | 29.2% | 12.4% |
Demographics Similar to Alsatians and Immigrants from the Azores by Single Female Poverty
In terms of single female poverty, the demographic groups most similar to Alsatians are American (24.5%, a difference of 0.080%), French American Indian (24.6%, a difference of 0.23%), Osage (24.4%, a difference of 0.37%), Indonesian (24.3%, a difference of 0.97%), and U.S. Virgin Islander (24.2%, a difference of 1.3%). Similarly, the demographic groups most similar to Immigrants from the Azores are Pennsylvania German (23.6%, a difference of 0.15%), Nonimmigrants (23.6%, a difference of 0.23%), Alaskan Athabascan (23.6%, a difference of 0.27%), Immigrants from Latin America (23.7%, a difference of 0.76%), and Mexican American Indian (23.4%, a difference of 0.78%).
| Demographics | Rating | Rank | Single Female Poverty |
| Marshallese | 0.1 /100 | #274 | Tragic 23.3% |
| Mexican American Indians | 0.1 /100 | #275 | Tragic 23.4% |
| Immigrants | Azores | 0.0 /100 | #276 | Tragic 23.5% |
| Pennsylvania Germans | 0.0 /100 | #277 | Tragic 23.6% |
| Immigrants | Nonimmigrants | 0.0 /100 | #278 | Tragic 23.6% |
| Alaskan Athabascans | 0.0 /100 | #279 | Tragic 23.6% |
| Immigrants | Latin America | 0.0 /100 | #280 | Tragic 23.7% |
| Immigrants | Zaire | 0.0 /100 | #281 | Tragic 23.8% |
| Guatemalans | 0.0 /100 | #282 | Tragic 23.8% |
| German Russians | 0.0 /100 | #283 | Tragic 23.9% |
| Immigrants | Dominica | 0.0 /100 | #284 | Tragic 23.9% |
| Immigrants | Guatemala | 0.0 /100 | #285 | Tragic 24.1% |
| Cree | 0.0 /100 | #286 | Tragic 24.1% |
| Bangladeshis | 0.0 /100 | #287 | Tragic 24.2% |
| Spanish Americans | 0.0 /100 | #288 | Tragic 24.2% |
| U.S. Virgin Islanders | 0.0 /100 | #289 | Tragic 24.2% |
| Indonesians | 0.0 /100 | #290 | Tragic 24.3% |
| Osage | 0.0 /100 | #291 | Tragic 24.4% |
| Alsatians | 0.0 /100 | #292 | Tragic 24.5% |
| Americans | 0.0 /100 | #293 | Tragic 24.5% |
| French American Indians | 0.0 /100 | #294 | Tragic 24.6% |