Alsatian vs Spanish American Indian Single Father Poverty
COMPARE
Alsatian
Spanish American Indian
Single Father Poverty
Single Father Poverty Comparison
Alsatians
Spanish American Indians
17.8%
SINGLE FATHER POVERTY
0.0/ 100
METRIC RATING
283rd/ 347
METRIC RANK
14.4%
SINGLE FATHER POVERTY
100.0/ 100
METRIC RATING
26th/ 347
METRIC RANK
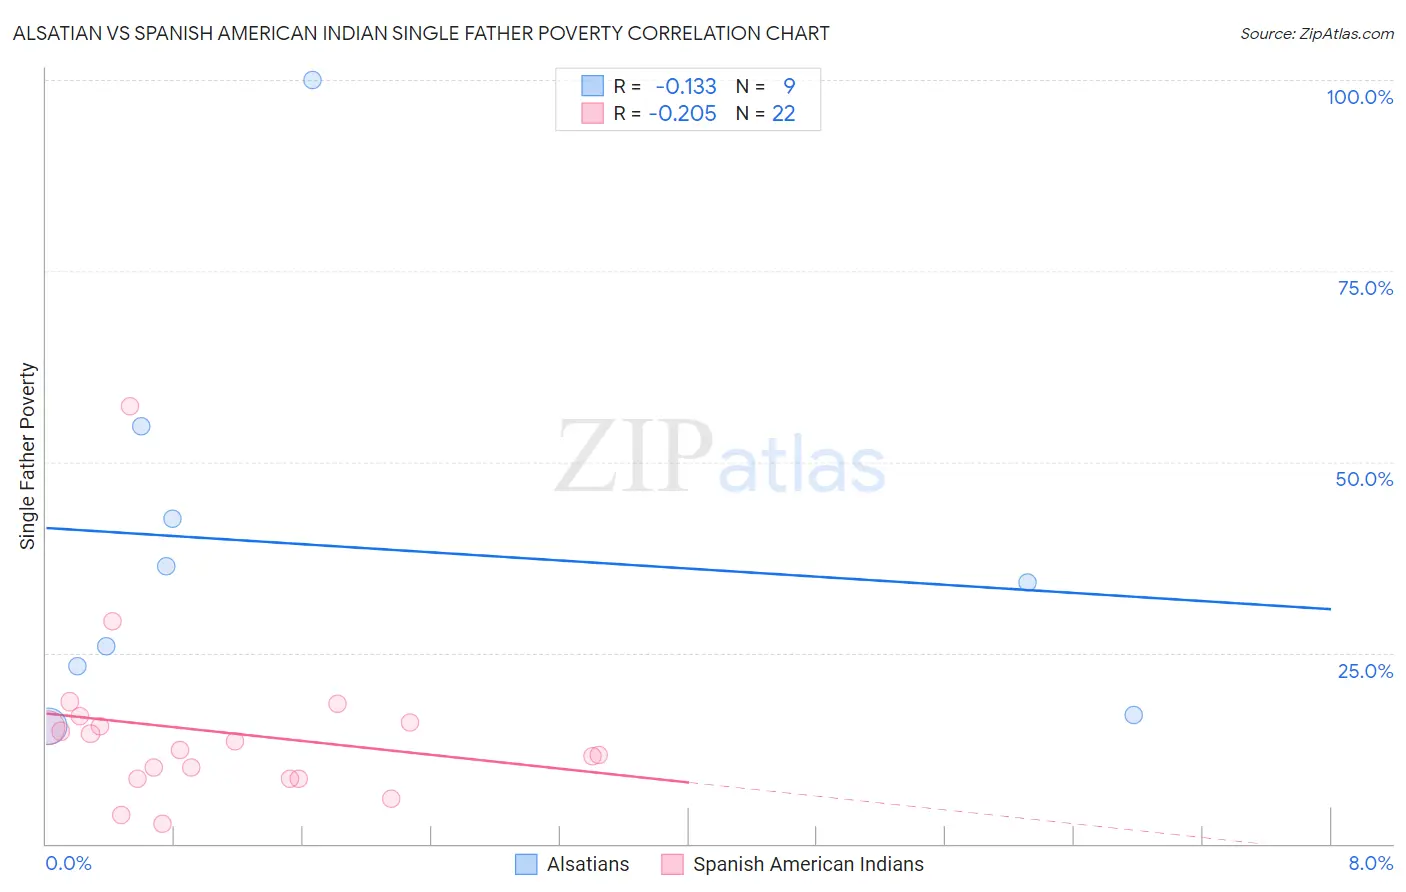
Alsatian vs Spanish American Indian Single Father Poverty Correlation Chart
The statistical analysis conducted on geographies consisting of 73,758,627 people shows a poor negative correlation between the proportion of Alsatians and poverty level among single fathers in the United States with a correlation coefficient (R) of -0.133 and weighted average of 17.8%. Similarly, the statistical analysis conducted on geographies consisting of 69,773,093 people shows a weak negative correlation between the proportion of Spanish American Indians and poverty level among single fathers in the United States with a correlation coefficient (R) of -0.205 and weighted average of 14.4%, a difference of 23.6%.
Single Father Poverty Correlation Summary
| Measurement | Alsatian | Spanish American Indian |
| Minimum | 15.4% | 2.6% |
| Maximum | 100.0% | 57.2% |
| Range | 84.6% | 54.6% |
| Mean | 38.8% | 14.6% |
| Median | 34.2% | 12.9% |
| Interquartile 25% (IQ1) | 20.1% | 8.5% |
| Interquartile 75% (IQ3) | 48.6% | 15.8% |
| Interquartile Range (IQR) | 28.5% | 7.3% |
| Standard Deviation (Sample) | 26.2% | 11.1% |
| Standard Deviation (Population) | 24.7% | 10.8% |
Similar Demographics by Single Father Poverty
Demographics Similar to Alsatians by Single Father Poverty
In terms of single father poverty, the demographic groups most similar to Alsatians are Welsh (17.8%, a difference of 0.020%), English (17.8%, a difference of 0.10%), Dutch (17.8%, a difference of 0.10%), Immigrants from Lebanon (17.9%, a difference of 0.38%), and Scottish (17.7%, a difference of 0.42%).
| Demographics | Rating | Rank | Single Father Poverty |
| German Russians | 0.0 /100 | #276 | Tragic 17.7% |
| Lebanese | 0.0 /100 | #277 | Tragic 17.7% |
| Germans | 0.0 /100 | #278 | Tragic 17.7% |
| Iroquois | 0.0 /100 | #279 | Tragic 17.7% |
| Scottish | 0.0 /100 | #280 | Tragic 17.7% |
| English | 0.0 /100 | #281 | Tragic 17.8% |
| Dutch | 0.0 /100 | #282 | Tragic 17.8% |
| Alsatians | 0.0 /100 | #283 | Tragic 17.8% |
| Welsh | 0.0 /100 | #284 | Tragic 17.8% |
| Immigrants | Lebanon | 0.0 /100 | #285 | Tragic 17.9% |
| Immigrants | North Macedonia | 0.0 /100 | #286 | Tragic 17.9% |
| Carpatho Rusyns | 0.0 /100 | #287 | Tragic 18.0% |
| Bahamians | 0.0 /100 | #288 | Tragic 18.0% |
| Irish | 0.0 /100 | #289 | Tragic 18.0% |
| West Indians | 0.0 /100 | #290 | Tragic 18.0% |
Demographics Similar to Spanish American Indians by Single Father Poverty
In terms of single father poverty, the demographic groups most similar to Spanish American Indians are Nepalese (14.4%, a difference of 0.050%), Iranian (14.4%, a difference of 0.42%), Immigrants from Egypt (14.4%, a difference of 0.46%), Immigrants from South Eastern Asia (14.4%, a difference of 0.46%), and Immigrants from South Central Asia (14.5%, a difference of 0.58%).
| Demographics | Rating | Rank | Single Father Poverty |
| Immigrants | Iraq | 100.0 /100 | #19 | Exceptional 14.3% |
| Immigrants | Singapore | 100.0 /100 | #20 | Exceptional 14.3% |
| Immigrants | Afghanistan | 100.0 /100 | #21 | Exceptional 14.3% |
| Taiwanese | 100.0 /100 | #22 | Exceptional 14.3% |
| Immigrants | Egypt | 100.0 /100 | #23 | Exceptional 14.4% |
| Immigrants | South Eastern Asia | 100.0 /100 | #24 | Exceptional 14.4% |
| Iranians | 100.0 /100 | #25 | Exceptional 14.4% |
| Spanish American Indians | 100.0 /100 | #26 | Exceptional 14.4% |
| Nepalese | 100.0 /100 | #27 | Exceptional 14.4% |
| Immigrants | South Central Asia | 100.0 /100 | #28 | Exceptional 14.5% |
| Somalis | 100.0 /100 | #29 | Exceptional 14.5% |
| Thais | 100.0 /100 | #30 | Exceptional 14.5% |
| Icelanders | 100.0 /100 | #31 | Exceptional 14.5% |
| Asians | 100.0 /100 | #32 | Exceptional 14.6% |
| Okinawans | 100.0 /100 | #33 | Exceptional 14.6% |